Hi Metabase Team,
My customers have complained that many of graphs we plot for 6-sigma analysis are not readable due to the y-axis always starting at 0. I researched the Metabase forums, and used a log plot as a work-around. But this only works for >0 values, and to be frank, it is a band-aid.
Is it possible for your team to look into scaling y-axis based on the max/min of the data set like done in log plots? Thanks
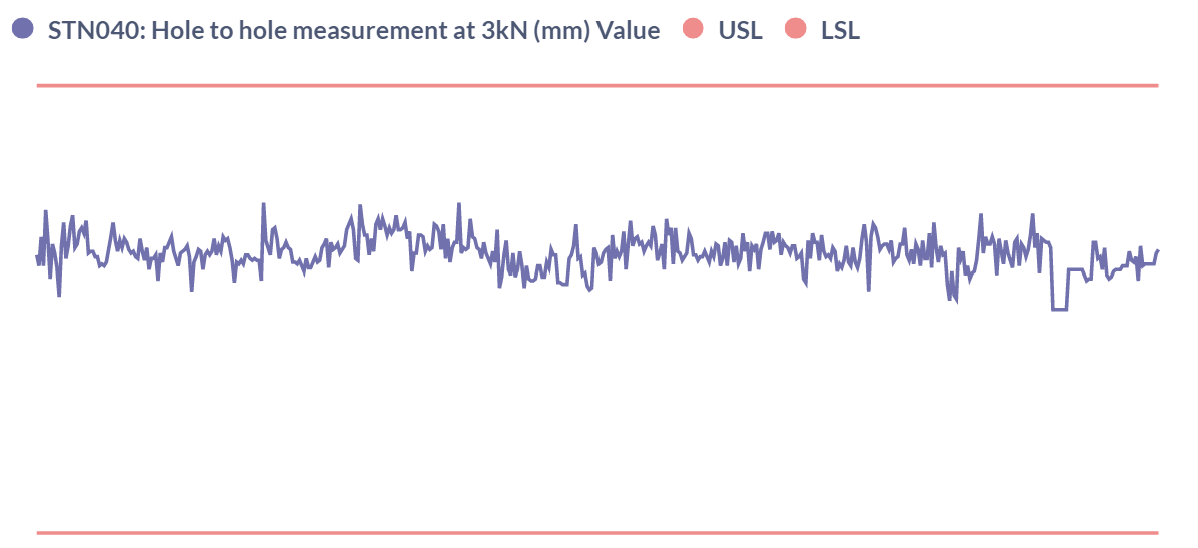
The linear visualization:

The log y-axis work-around (much more readable):
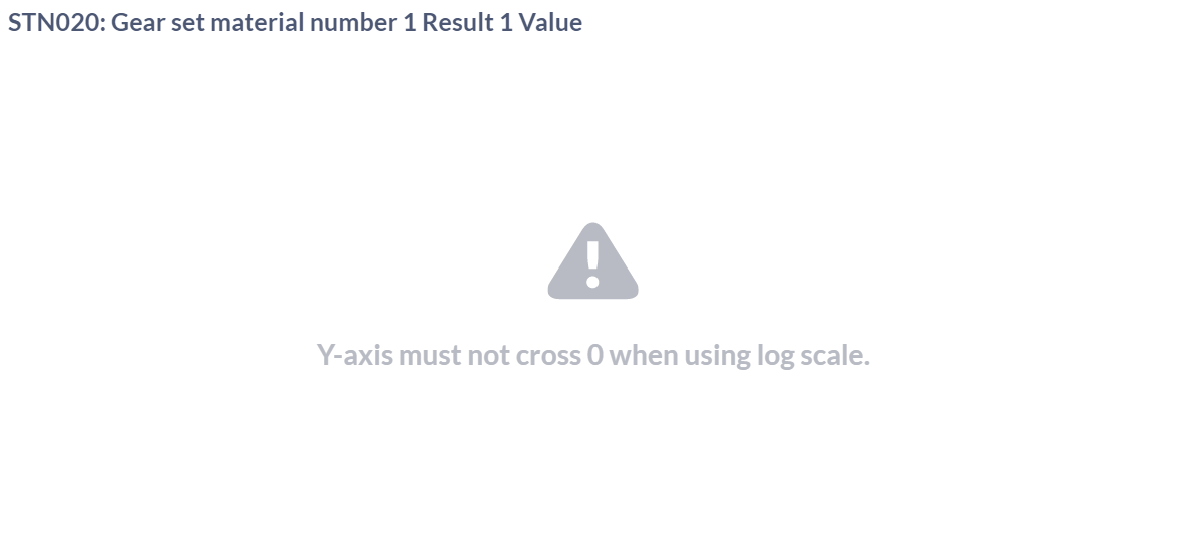
The work-around only woks for select cases:
 on the first post of the issue: