Hi,
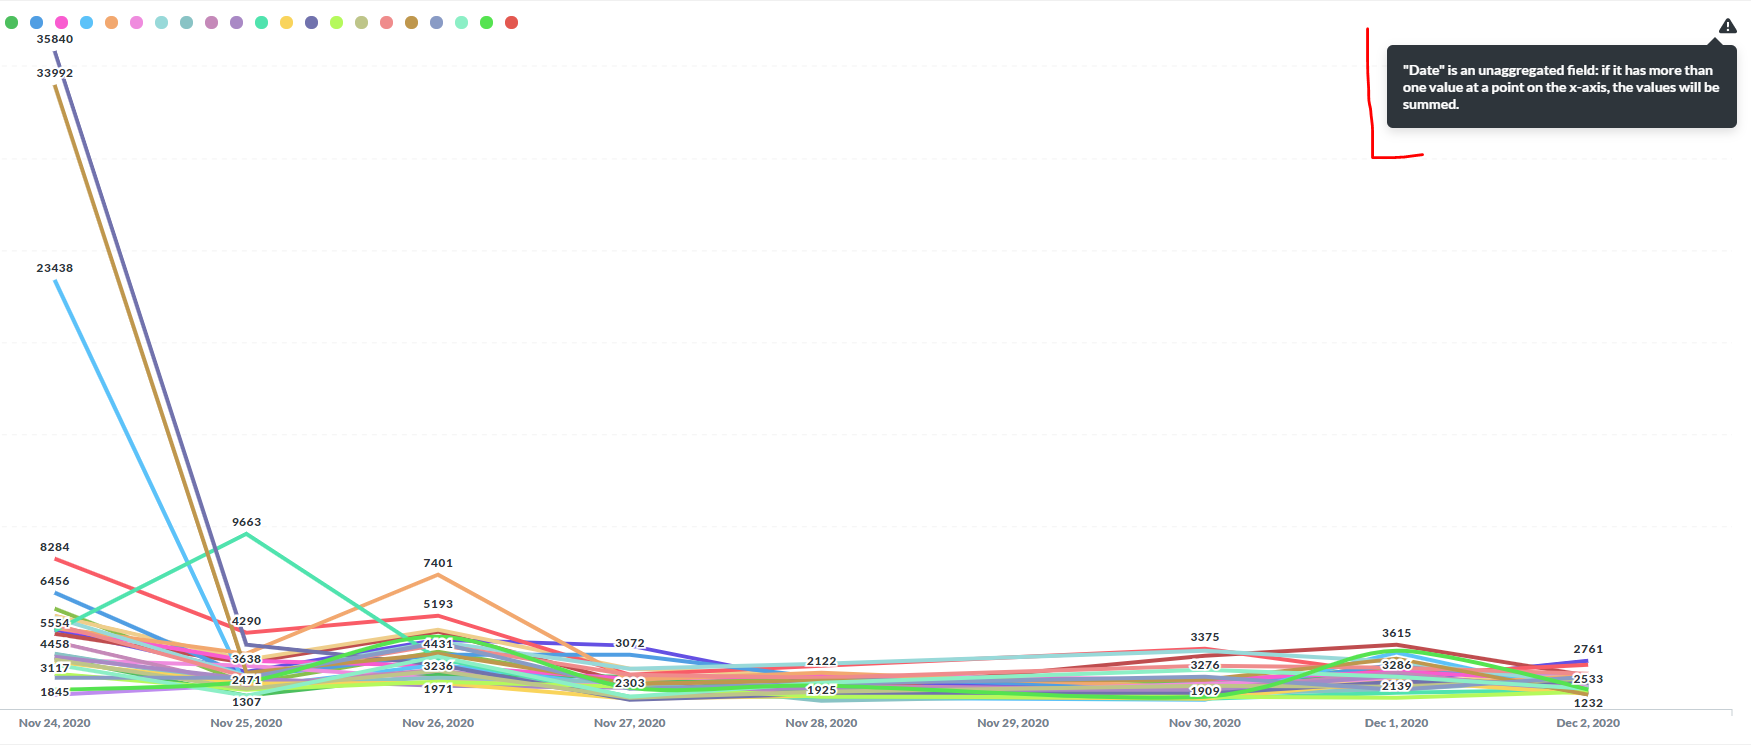
In our DB for each X have multiple values for Y, so metabase always renders summed value of y ( for given x value )
Is there any way to make it show the average values instead of just sum?
I was trying to play with settings, but couldn't anything that could tweak this.
@flamber , can’t find this “grouping” feature, we use simple-question approach, can you please point me were I can find it?
or are you talking to visualize via sql query and make do GROUP BY in there?
@Levon Click the Summarize button to show the sidebar - or click the Editor button in top-right corner to show the Notebook mode.
I would recommend that you read these: Redirecting… Redirecting…