Hello
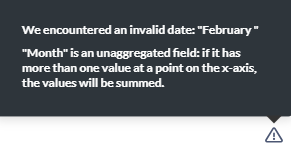
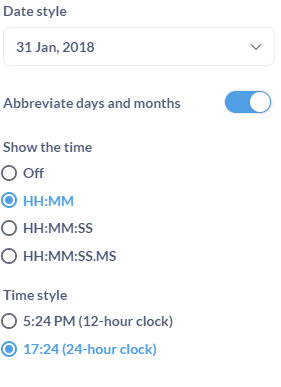
I've been trying to set up a chart to compare two years to one another using SQL. That's quite easy to do by using an interval to shift the dates forward one year but I've hit a second issue where I want to hide the year and use only the month on the X axis - in other words instead of saying 'January 2023' just to say 'January'. Frustratingly this does not seem to be an option by default in the date display
which means you can end up with data assigned to months which haven't even happened yet. Allowing that to be chosen would make my second issue irrelevant.
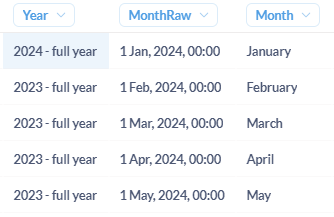
Now to work around this limit I've just decided to use postgres to output only the month name which is easy to do and for example this works just fine in a table:
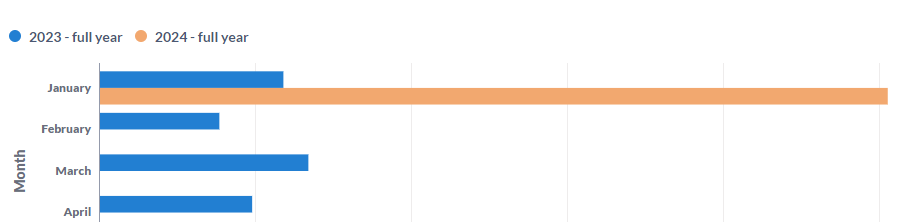
and perfectly happily as a row chart...
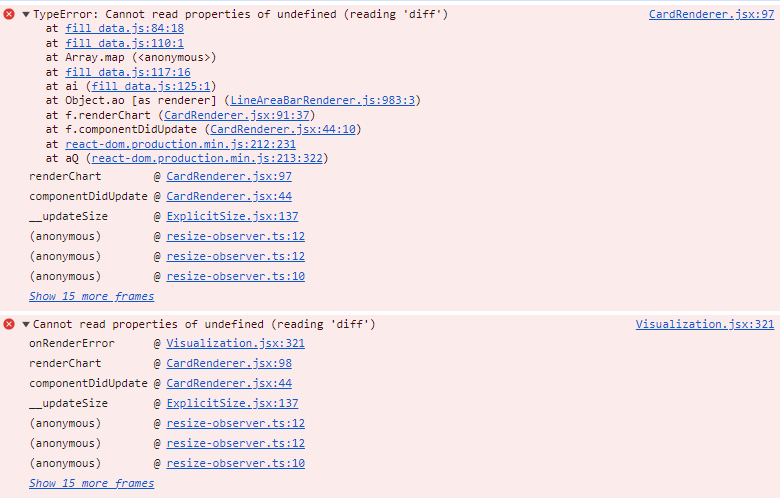
but when asked to form a bar chart or a line/area chart we get
which I assume is because it's trying to work out the difference between the rows for the X axis in some automatic way and failing. Frankly I'm somewhat confused as to why it happens only in this specific case though.
I'm on the latest version of non-enterprise metabase.
Oh and another weirdness: if I change the year text from YYYY - full year to just YYYY we no longer get the error, instead just a completely blank chart
So probably something is going wrong with that part of the code.
The error 'Cannot read properties of undefined (reading 'diff') also occurs if you attempt to chart with a null date. This was previously working fine with 0.47 for me as I can see it working (producing a blank chart instead of an error) in a saved PDF export of a dasboard and is broken now I am using 0.48
I tried to roll back to test it and apparently metabase's database does not like you trying that because of a migrations error so that wasn't going to work.
Given that it's clearly a js error, it happens only to certain types of charts and I can't see anything relevant in metabase's admin logs it's probably in the rendering code.
Or would it be better to stick this on github and get some visibility. It should be fairly easy to recreate.
I've dug even more into this and somehow the exact same sql query works without errors if I copy and paste the query into a new question and save it. Identical queries, even when I press the little eye icon to compare the raw SQL. Which further confirms something is wrong with the code that renders the charts specifically.
Frankly I'm pretty mystified. I can see that the broken bar chart has a split Y axis and the working one does not, is this perhaps the problem? Dodgy code trying to compare the different columns to check if the Y axis should be split and getting confused?
Row charts do not allow splitting the Y axis, bar and line charts do so that would at least be consistent.
Edit: the Y axis splitting doesn't seem to be the cause, or at least I can't reliably pin it down to that.
I've dug even more into this and somehow the exact same sql query works without errors if I copy and paste the query into a new question and save it. Identical queries, even when I press the little eye icon to compare the raw SQL. Which further confirms something is wrong with the code that renders the charts specifically.
And then after five minutes the new working query stops working and shows the same error. I feel like this is about as far as I can take this myself.
Well I've managed to crack at least one cause of this error and make it reproducible.
The problem occurs whenever you choose a value other than 'linear interpolated' for missing values of a line in bar or line/area charts and then you have no values at all for that line + an already pretty 'empty' graph for the other columns

Which is annoying as linear interpolated tends to make people think fake data exists where the value should be zero but at least it's sort-of working.
I've also previously posted about another issue that happens when you turn off linear interpolation so it feels like that's a use case that's not being tested very often Line chart goes under x axis when value is zero - #2 by AndrewMBaines