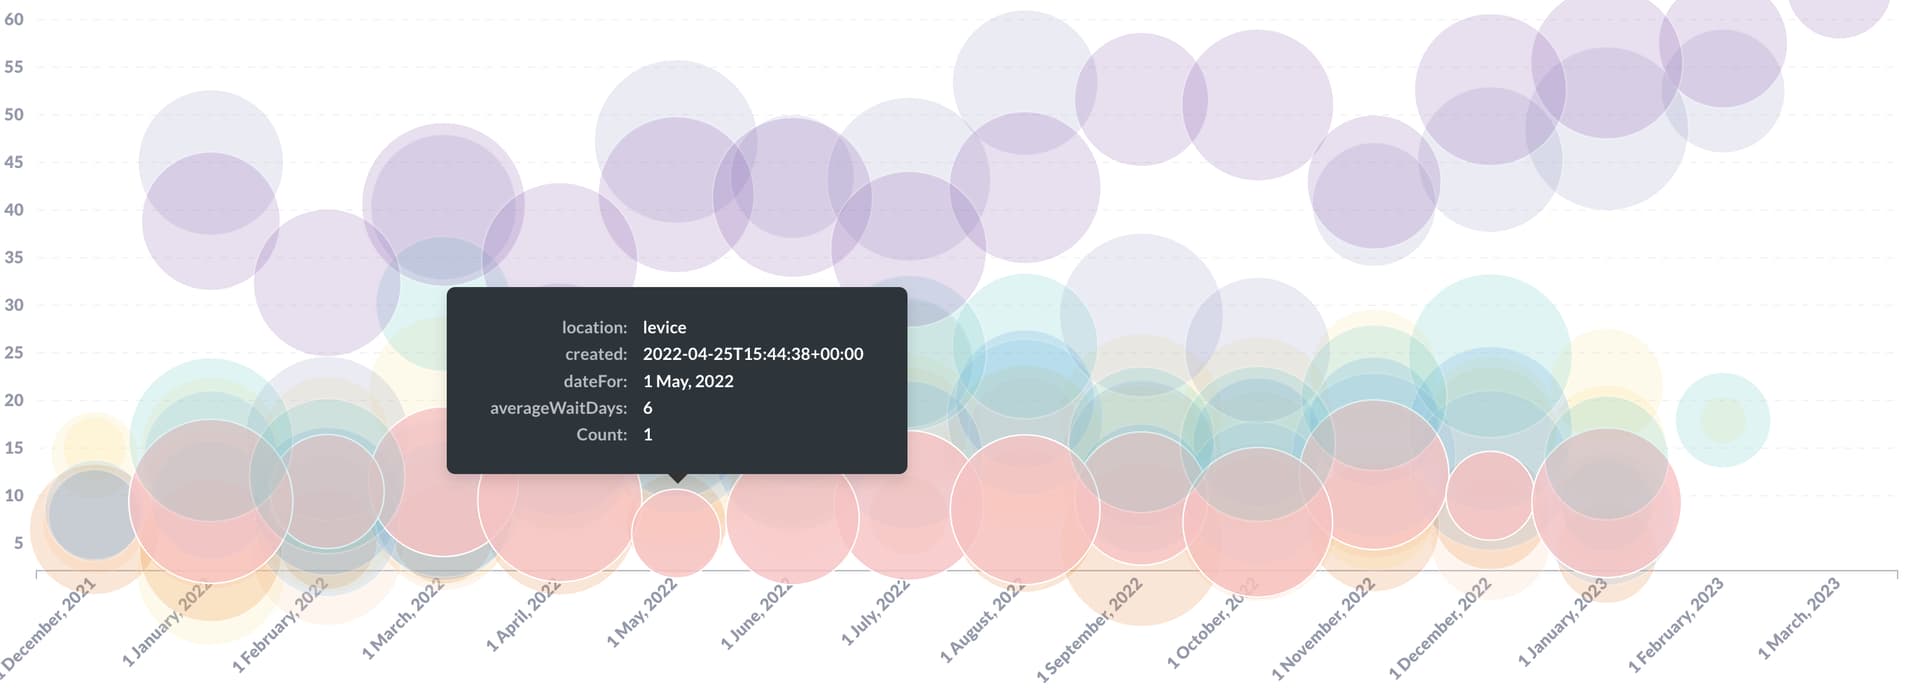
I wanted to create a Bubble chart, but the sizes of bubbles make the chart illegible. The values used for the bubble (column 'count') span from 1 to 50, why is the bubble for value 1 so big? Why can't I change this in settings? Thanks for any answers.
You can upvote this issue: Ability to specify the Scale Factor in Scatter Plots · Issue #11896 · metabase/metabase · GitHub
thank you! did so
Top priority for me.