I know we have waterfall chart, but I wonder if we can have multiple charts in a waterfall chart?
I am a new user so I cannot upload photo, please see my illustration photo in this link: IMG_0438.HEIC - Google Drive
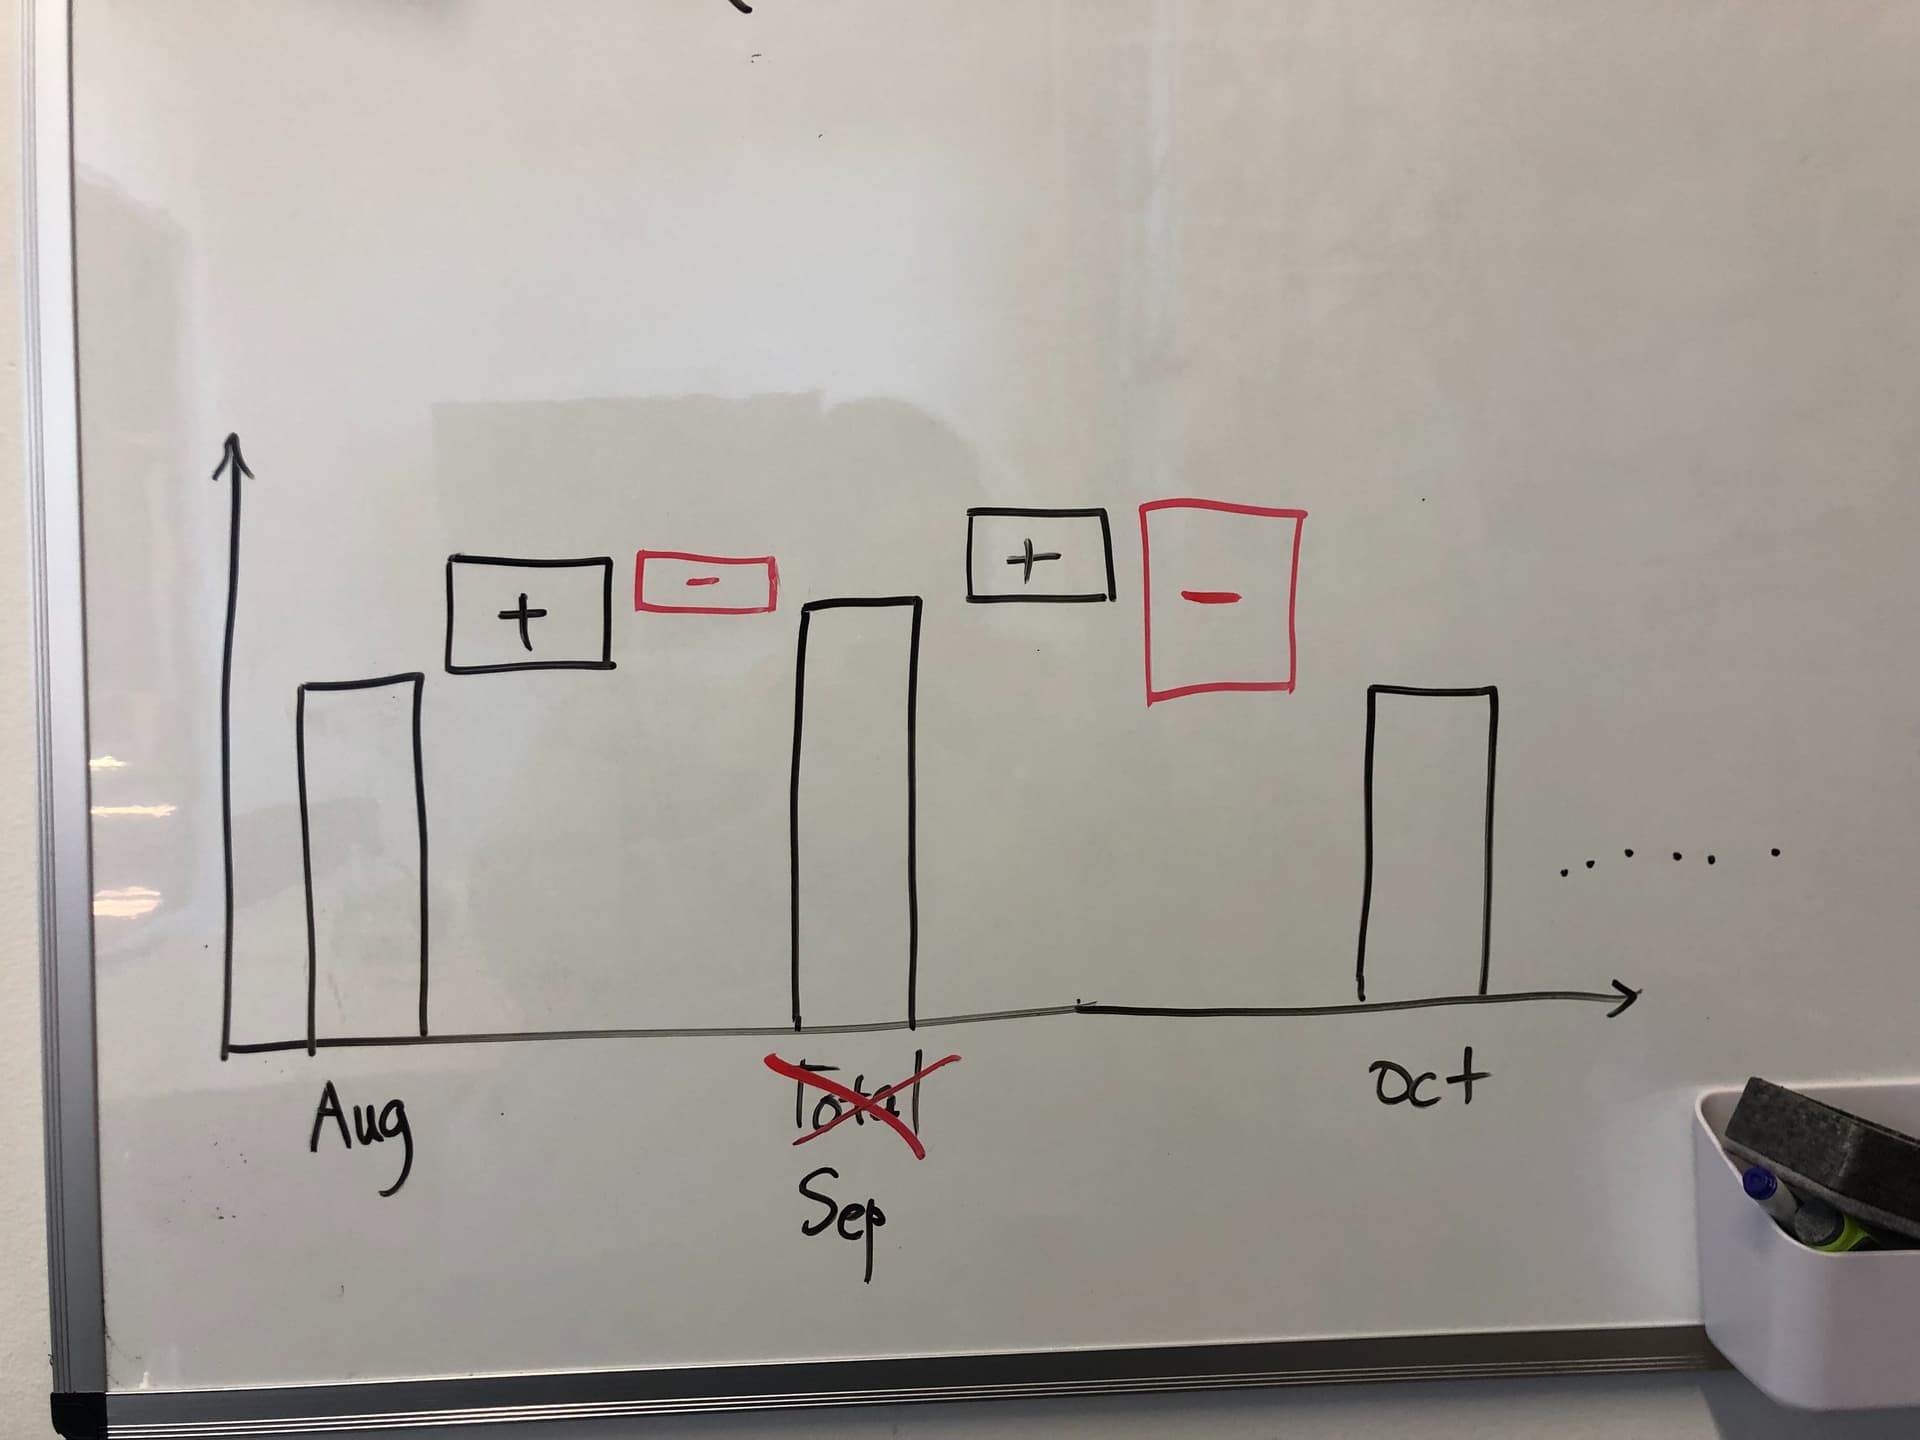
I want to show the sales and the change in sales for each month. The waterfall part (+ and -) is the change, and the total column is the sale of the next month.
My question is:
- Can I rename "Total" in waterfall chart to "Sep" (as in the attached link)?
- Can I add more data after the total column to continue my waterfall?
Hi @diloloan72
Waterfall doesn't support multiple series, and there's a bug open about it allowing it in certain cases https://github.com/metabase/metabase/issues/25597
It looks like you would probably want something like box plot instead:
https://github.com/metabase/metabase/issues/10783 - upvote by clicking  on the first post
Not sure why you can't paste an image. New users can do that.
If I cannot have multiple series in the waterfall chart, can I at least rename the "Total" to "Sep" as in the photo above?
Thanks for pointing out box plot, but I'm not sure how box plot can achieve what I want as in the photo tho because I want to show both the increase and the decrease within a month.
@diloloan72 You cannot rename Total, but it would also not be positioned in the middle.
I think the only solution currently would be to create a stacked Bar, which would require you returning 3 rows for each month.
Either way, Metabase doesn't have an exact visualization you are looking for.