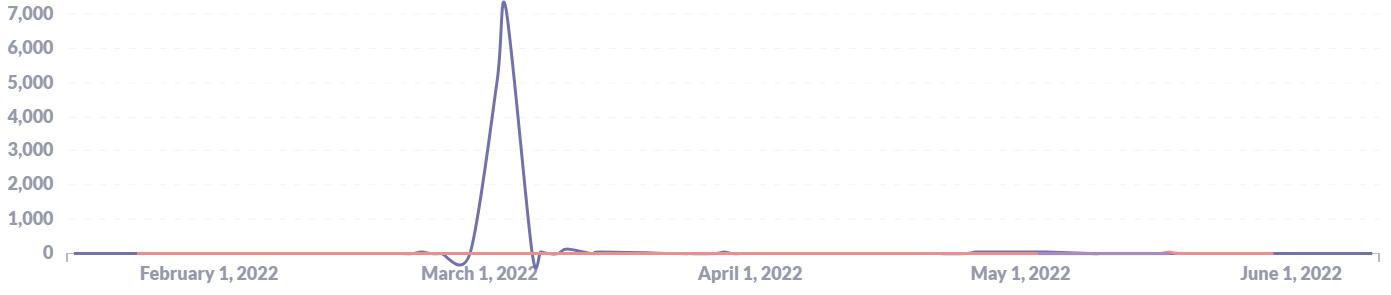
when I create a line chart it gives values automatically , how to change its values

here the values are in 1000s , Iwant to change it to 100s maybe , also the x axis
when I create a line chart it gives values automatically , how to change its values
here the values are in 1000s , Iwant to change it to 100s maybe , also the x axis
Hi @sgayathri
You need to provide more context or a screenshot, so it is possible to understand what your problem is.
Post "Diagnostic Info" from Admin > Troubleshooting.
@sgayathri Use split Y-axis. If you want to manipulate the results, then do it with filters and expressions.
https://www.metabase.com/docs/latest/users-guide/05-visualizing-results.html#options-for-line-bar-and-area-charts
https://www.metabase.com/docs/latest/users-guide/expressions.html