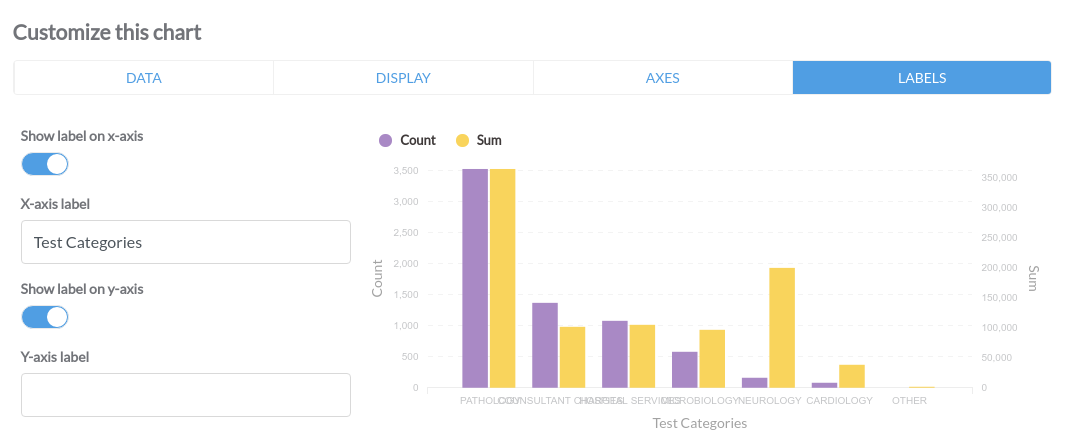
Unable to change the label for secondary y-axis the y-axis on the left needs to be volume and the right needs to be revenue, but changing the value in y-axis changes both the axes . The chart has to be plotted against revenue vs volume
3 Likes
I’m running across the same issue and see that this hasn’t been addressed in v0.28.1. Hopefully it comes out in a new release.