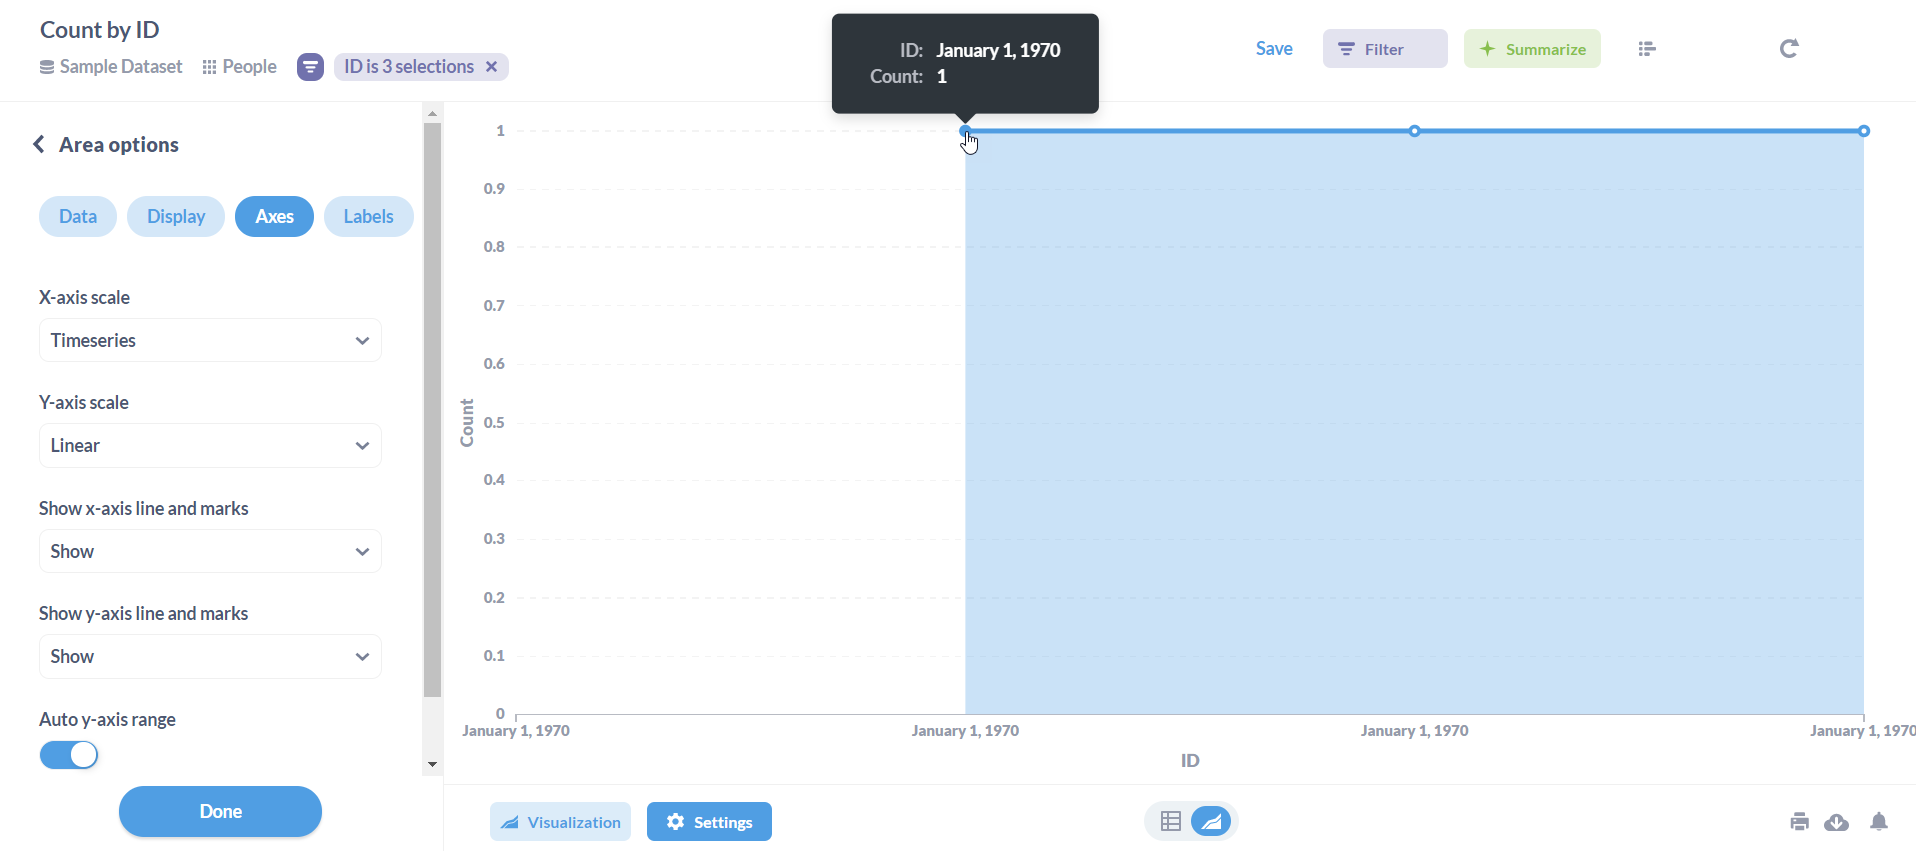
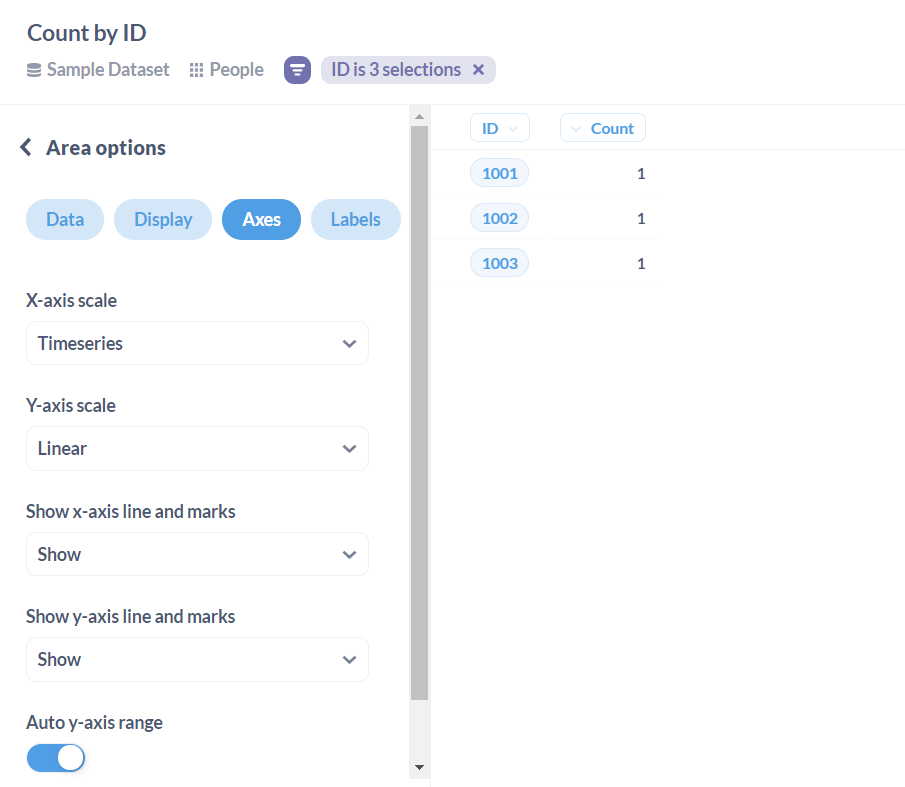
Hi i have a column(ID) of entity type which has all values greater than 1000, when i try to summarize data with that column, i end up having a graph with x-axis showing me some default date January1,1970 with x-axis in timeseries along with tooltip and i am not able to make any selection due to it.
Tried the same with sampledata database and was able to replicate the issue , below is reference images
Hi @flamber,
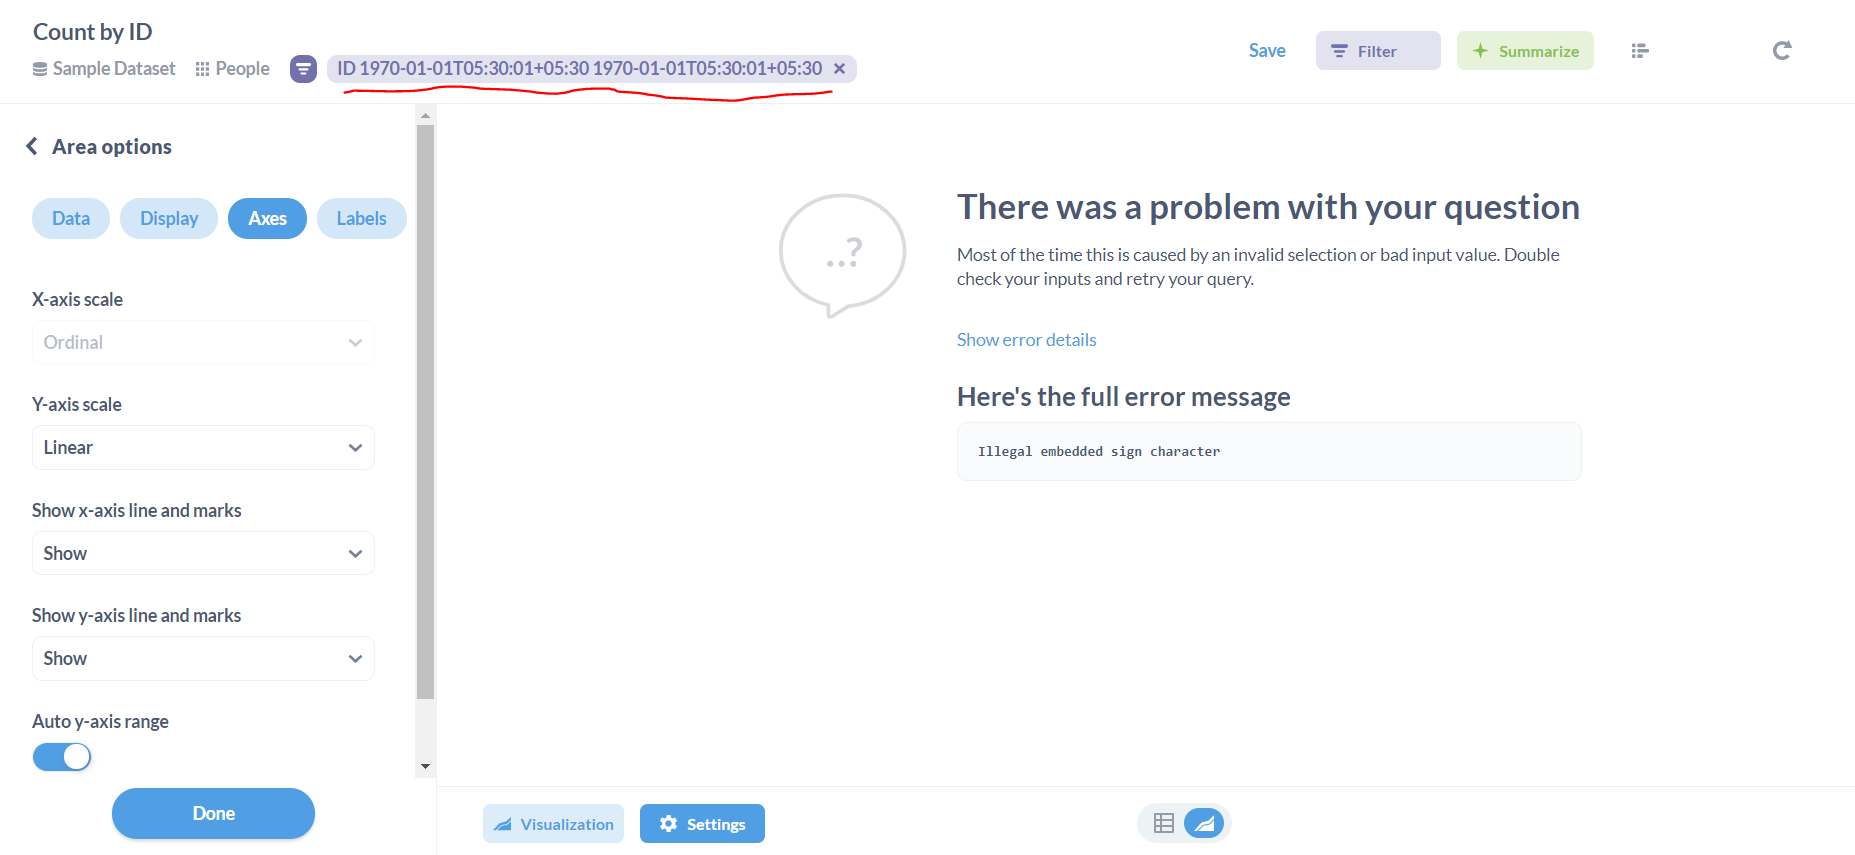
Changing x-axis to any other than timeseries resolves the representation issues, but when i try to filter out the result by dragging over the chart somehow the date filters are being applied again and i get the following error, i tried changing the column type to others too but getting same result, although if i have any data in the result less then 1000 then everything works fine.
@Chetan Post "Diagnostic Info" from Admin > Troubleshooting. Looks like you're using a custom build. I cannot reproduce on any official build, since when setting Ordinal, then drag-to-drill is not possible.
 on the first post