I have the beginnings of a combo chart that looks like this:
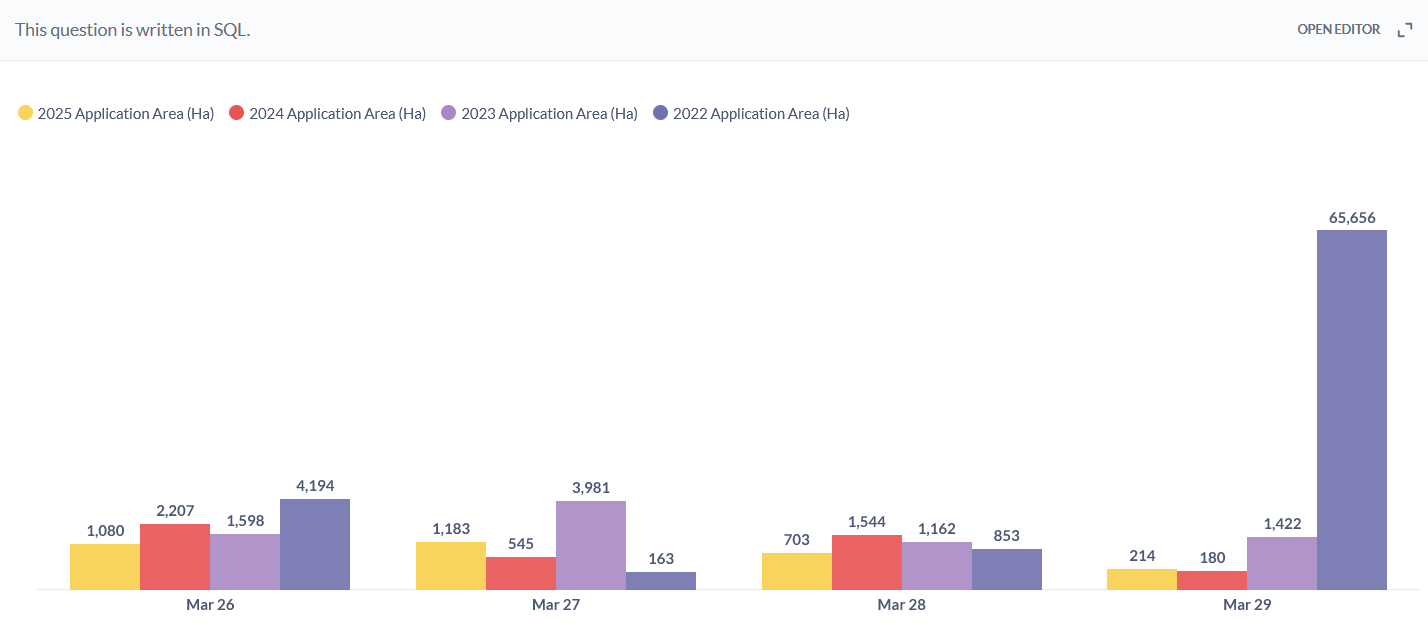
showing year-over-year areas on the date for the last 4 years that is set up like this:
I want to add a line over each date that shows data points for average area for each year like this
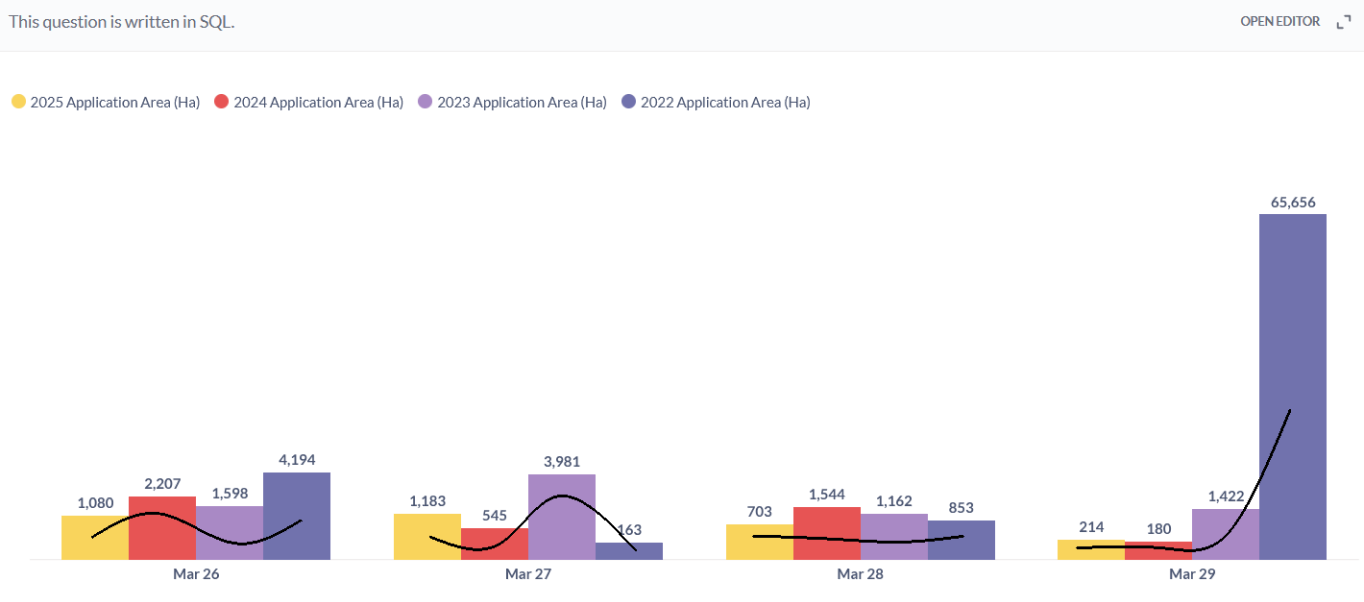
Note: I drew those lines in using paint. The combo chart should also show data points for average area for each bar within each date.
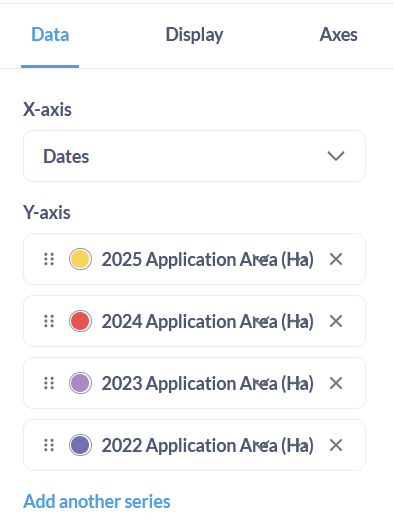
I am having trouble trying to make this happen in Metabase. Theoretically, I think I want to break out the x axis by year, however the GUI doesn't give me that option
The underlying t query looks like this:
select
  to_char(d.date_value, 'Mon DD') as "Dates",
  c2025.total_area_ha as "2025 Application Area (Ha)",
  c2025.average_area_ha as "2025 Average Application Area (Ha)",
  c2024.total_area_ha as "2024 Application Area (Ha)",
  c2024.average_area_ha as "2024 Average Application Area (Ha)",
  c2023.total_area_ha as "2023 Application Area (Ha)",
  c2023.average_area_ha as "2023 Average Application Area (Ha)",
  c2022.total_area_ha as "2022 Application Area (Ha)",
  c2022.average_area_ha as "2022 Average Application Area (Ha)"
from
  datelist d
  left join cext2025 c2025
  on extract(month from d.date_value) = extract(month from c2025.submission_date)
  and extract(day from d.date_value) = extract(day from c2025.submission_date)
  left join cext2024 c2024
  on extract(month from d.date_value) = extract(month from c2024.issue_date)
  and extract(day from d.date_value) = extract(day from c2024.issue_date)
  left join cext2023 c2023
  on extract(month from d.date_value) = extract(month from c2023.issue_date)
  and extract(day from d.date_value) = extract(day from c2023.issue_date)
  left join cext2022 c2022
  on extract(month from d.date_value) = extract(month from c2022.issue_date)
  and extract(day from d.date_value) = extract(day from c2022.issue_date)
where
  to_char(d.date_value, 'YYYY-MM-DD') >= '2025-03-26'
order by
  d.date_value
I've tried to change the query to pivot the data in a few different ways, but I can't seem to figure out how to make this happen. I've made enough attempts to change things in the query and GUI but nothing seems to work which leads me t believe it may not be possible. Any help would be appreciated.
Lastly, here is a cte sample, if anyone wants to tinker:
WITH application_data AS (
    SELECT TO_DATE('2025-03-26', 'YYYY-MM-DD') AS Dates, 2025 AS Year, 2207 AS Application_Area_2024_Ha, 200.7 AS Average_Acquisition_Area_2024_Ha, 1598 AS Application_Area_2023_Ha, 99.9 AS Average_Acquisition_Area_2023_Ha, 4194 AS Application_Area_2022_Ha, 209.7 AS Average_Acquisition_Area_2022_Ha, 1080 AS Application_Area_2025_Ha, 72 AS Average_Acquisition_Area_2025_Ha
    FROM DUAL
    UNION ALL
    SELECT TO_DATE('2025-03-27', 'YYYY-MM-DD'), 2025, 545, 108.9, 3981, 265.3, 163, 54.5, 1183, 107.4
    FROM DUAL
    UNION ALL
    SELECT TO_DATE('2025-03-28', 'YYYY-MM-DD'), 2025, 1544, 128.6, 1162, 96.8, 853, 142.3, 703, 140.6
    FROM DUAL
    UNION ALL
    SELECT TO_DATE('2025-03-29', 'YYYY-MM-DD'), 2025, 180, 59.9, 1422, 83.8, 65656, 228.8, 214, 35.7
    FROM DUAL
)
SELECT * FROM application_data