Hi
Is there any feature available on graph where we can have all Y axis series in drop down list. So when i select any series from drop down it will display specific graph related to it.
Hi @Prajakta2021
I don't think I understand. Can you give more details or screenshots, so it's easier to understand?
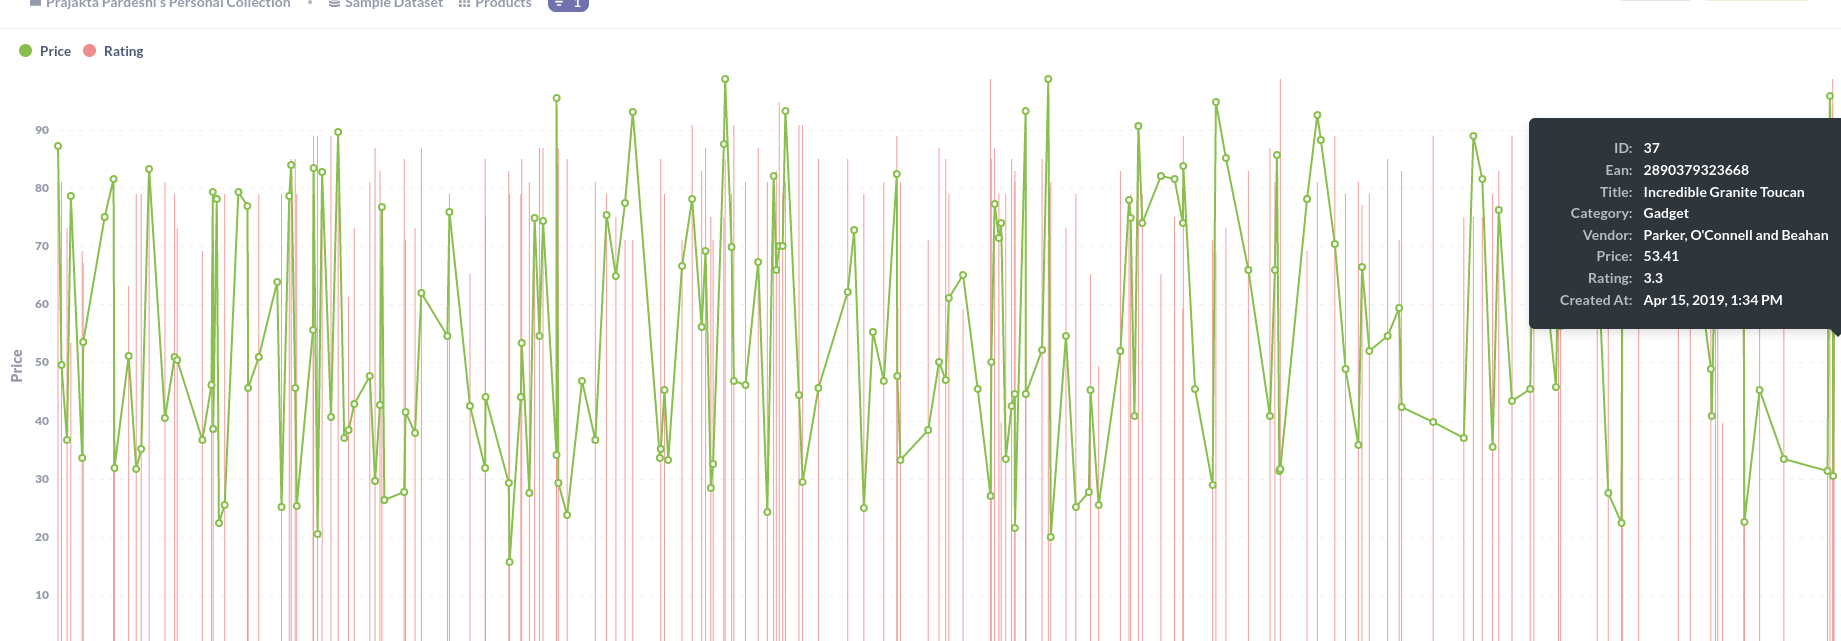
If you see attached graph, I have used Price and Rating values to display on Y axis. I want these series name in dropdown or radio button or checkbox . So when i click Price then only price details should be display on the graph.
@Prajakta2021 There's a request for that:
https://github.com/metabase/metabase/issues/2697 - upvote by clicking  on the first post
@Prajakta2021 Different problems, different topics.
Post "Diagnostic Info" from Admin > Troubleshooting.
I cannot see if you have multiple X-axis values, which would show a triangle in upper-right corner with an error message about summed aggregation.
Oh I see. Is there any way where i can show these value separated. let ot be 3 dots for all 3 values on graph
@Prajakta2021 Yes, group by something that makes different series.