Hello,
I am solving a problem with a fixed limit (hardcoded in metabase files) on the number of series in the graphs. For example, when using any pie chart, this is not a problem, but when using a composite chart, it is already a problem.
Same chart with different date range:
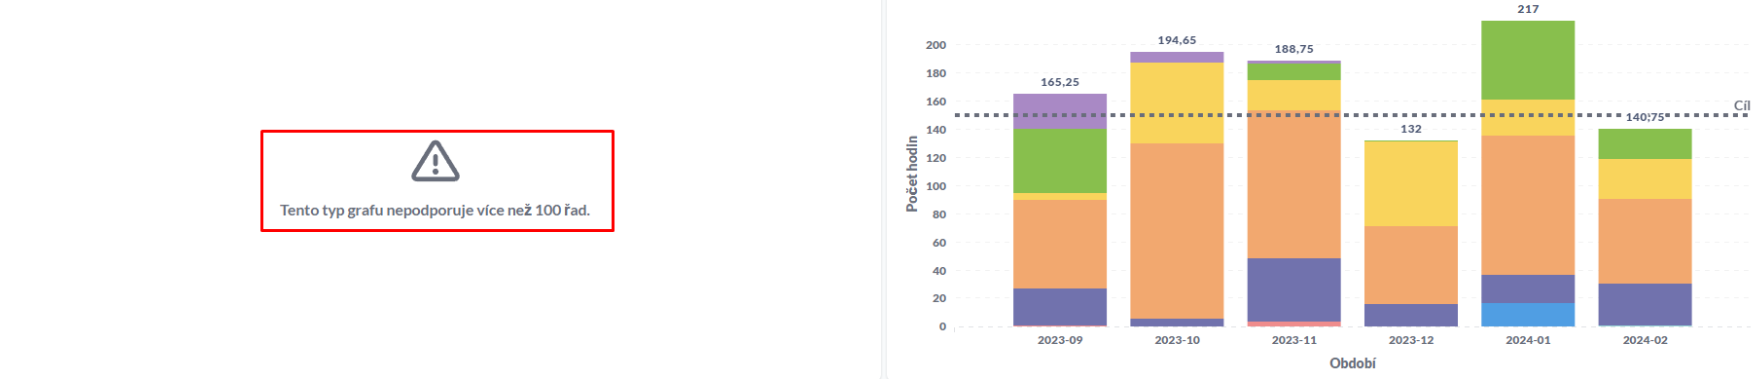
The graph on the left uses about 500 series, the graph on the right uses about 60 series in total.
In the source code I discovered that this is a constant that is set by the source code (hardcoded here : metabase/frontend/src/metabase/visualizations/lib/utils.js at 3768351e488698eae11fa615434475e7834f0b39 · metabase/metabase · GitHub), would there be any possibility to edit this value, for example from the administration, or some config?
I don't see any problem in increasing the "max_series" variable here for this type of graph.
Thank you very much for any feedback.