Hi everyone,
I’m trying to build a chart in Metabase with the visual query editor and I’m hitting a limitation.
What I want:
-
A daily cumulative sum of a metric (e.g. margin)
-
Displayed day by day
-
For multiple years
-
With the cumulative total resetting to 0 every January 1st
-
Ideally in one single question, without duplicating queries per year
What works:
What doesn’t seem possible in the visual editor:
-
A cumulative sum partitioned by year (i.e. reset each year)
-
There is no way to define a “cumulative sum per year” or a partition key
-
Grouping by day of year mixes different years together
-
Grouping by date gives a continuous cumulative total across years
Question:
Is there a way (or a planned feature) to create a cumulative aggregation with a reset by year directly in the Metabase visual query builder, without using SQL?
Thanks in advance!
If you use 2 grouping columns in the Cumulative Sum summary line, the first one becomes the grouping of individual rows and the second one becomes the PARTITION BY.
To create a running annual sales column using Sample Database, summarize ORDERS like this:
Emits this SQL:
SELECT
  "source"."CREATED_AT" AS "CREATED_AT",
  "source"."CREATED_AT_2" AS "CREATED_AT_2",
  SUM(SUM("source"."TOTAL")) OVER (
    PARTITION BY "source"."CREATED_AT_2"

ORDER BY
      "source"."CREATED_AT_2" ASC,
      "source"."CREATED_AT" ASC ROWS UNBOUNDED PRECEDING
  ) AS "sum"
FROM
  (
    SELECT
      CAST("PUBLIC"."ORDERS"."CREATED_AT" AS date) AS "CREATED_AT",
      DATE_TRUNC('year', "PUBLIC"."ORDERS"."CREATED_AT") AS "CREATED_AT_2",
      "PUBLIC"."ORDERS"."TOTAL" AS "TOTAL"
    FROM
      "PUBLIC"."ORDERS"
  ) AS "source"
GROUP BY
  "source"."CREATED_AT",
  "source"."CREATED_AT_2"
ORDER BY
  "source"."CREATED_AT_2" ASC,
  "source"."CREATED_AT" ASC
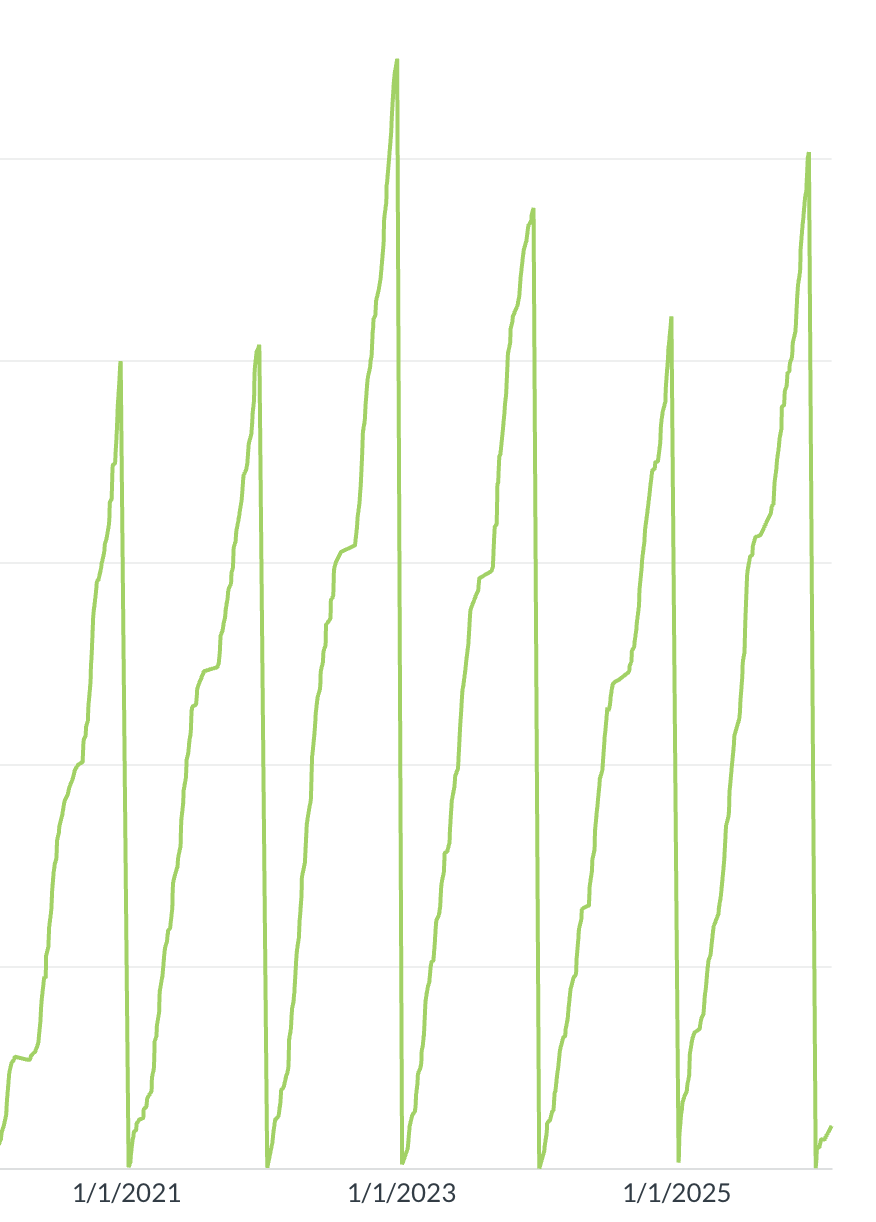
and resets every Jan 1:
OK, thanks a lot. With 2 groupings, I’ve something like that.
Ideally, I’d love to have one graph per year, on top of each other, with different colors. Is that possible ?
That is trickier. Metabase doesn’t have a built-in ‘group by day of year,’ so we need to invent something.
The standard way this is done in data warehouses is a ‘calendar table’ that lists the days of the year. These are created either using database functions or as a static table. The table has columns like ‘month’, ‘day’, and ‘day of year’. Joining our data to that table sorts it by the calendar. This will automatically add new years as they occur, adding rows for each new day, but you can run into Metabase’s default row limit (2,000) if you count too many years.
It’s also possible to use self-joins to add individual years as columns, but it hard-codes the years and its difficult to get good performance from the notebook editor. It can be made dynamic (add new years automatically) but it gets database-specific, and in some cases you need to use its procedural language to build queries using Dynamic SQL techniques.
I have month isolated on my report data already and so used that when I was playing with this recently b/c I didn’t need anything quite day-granular.
But also have a solid DIMDates sheet that I use in my warehouse – it may be too big for directly in Metabase. Happy to share - is left over from my Sisense Days: https://community.sisense.com/kb/data_models/date-dimension-file/707
I also use this to calculate YTD for a quick on/off switch for YTD comparisons.