I’m fairly sure what I try seems to be impossible.
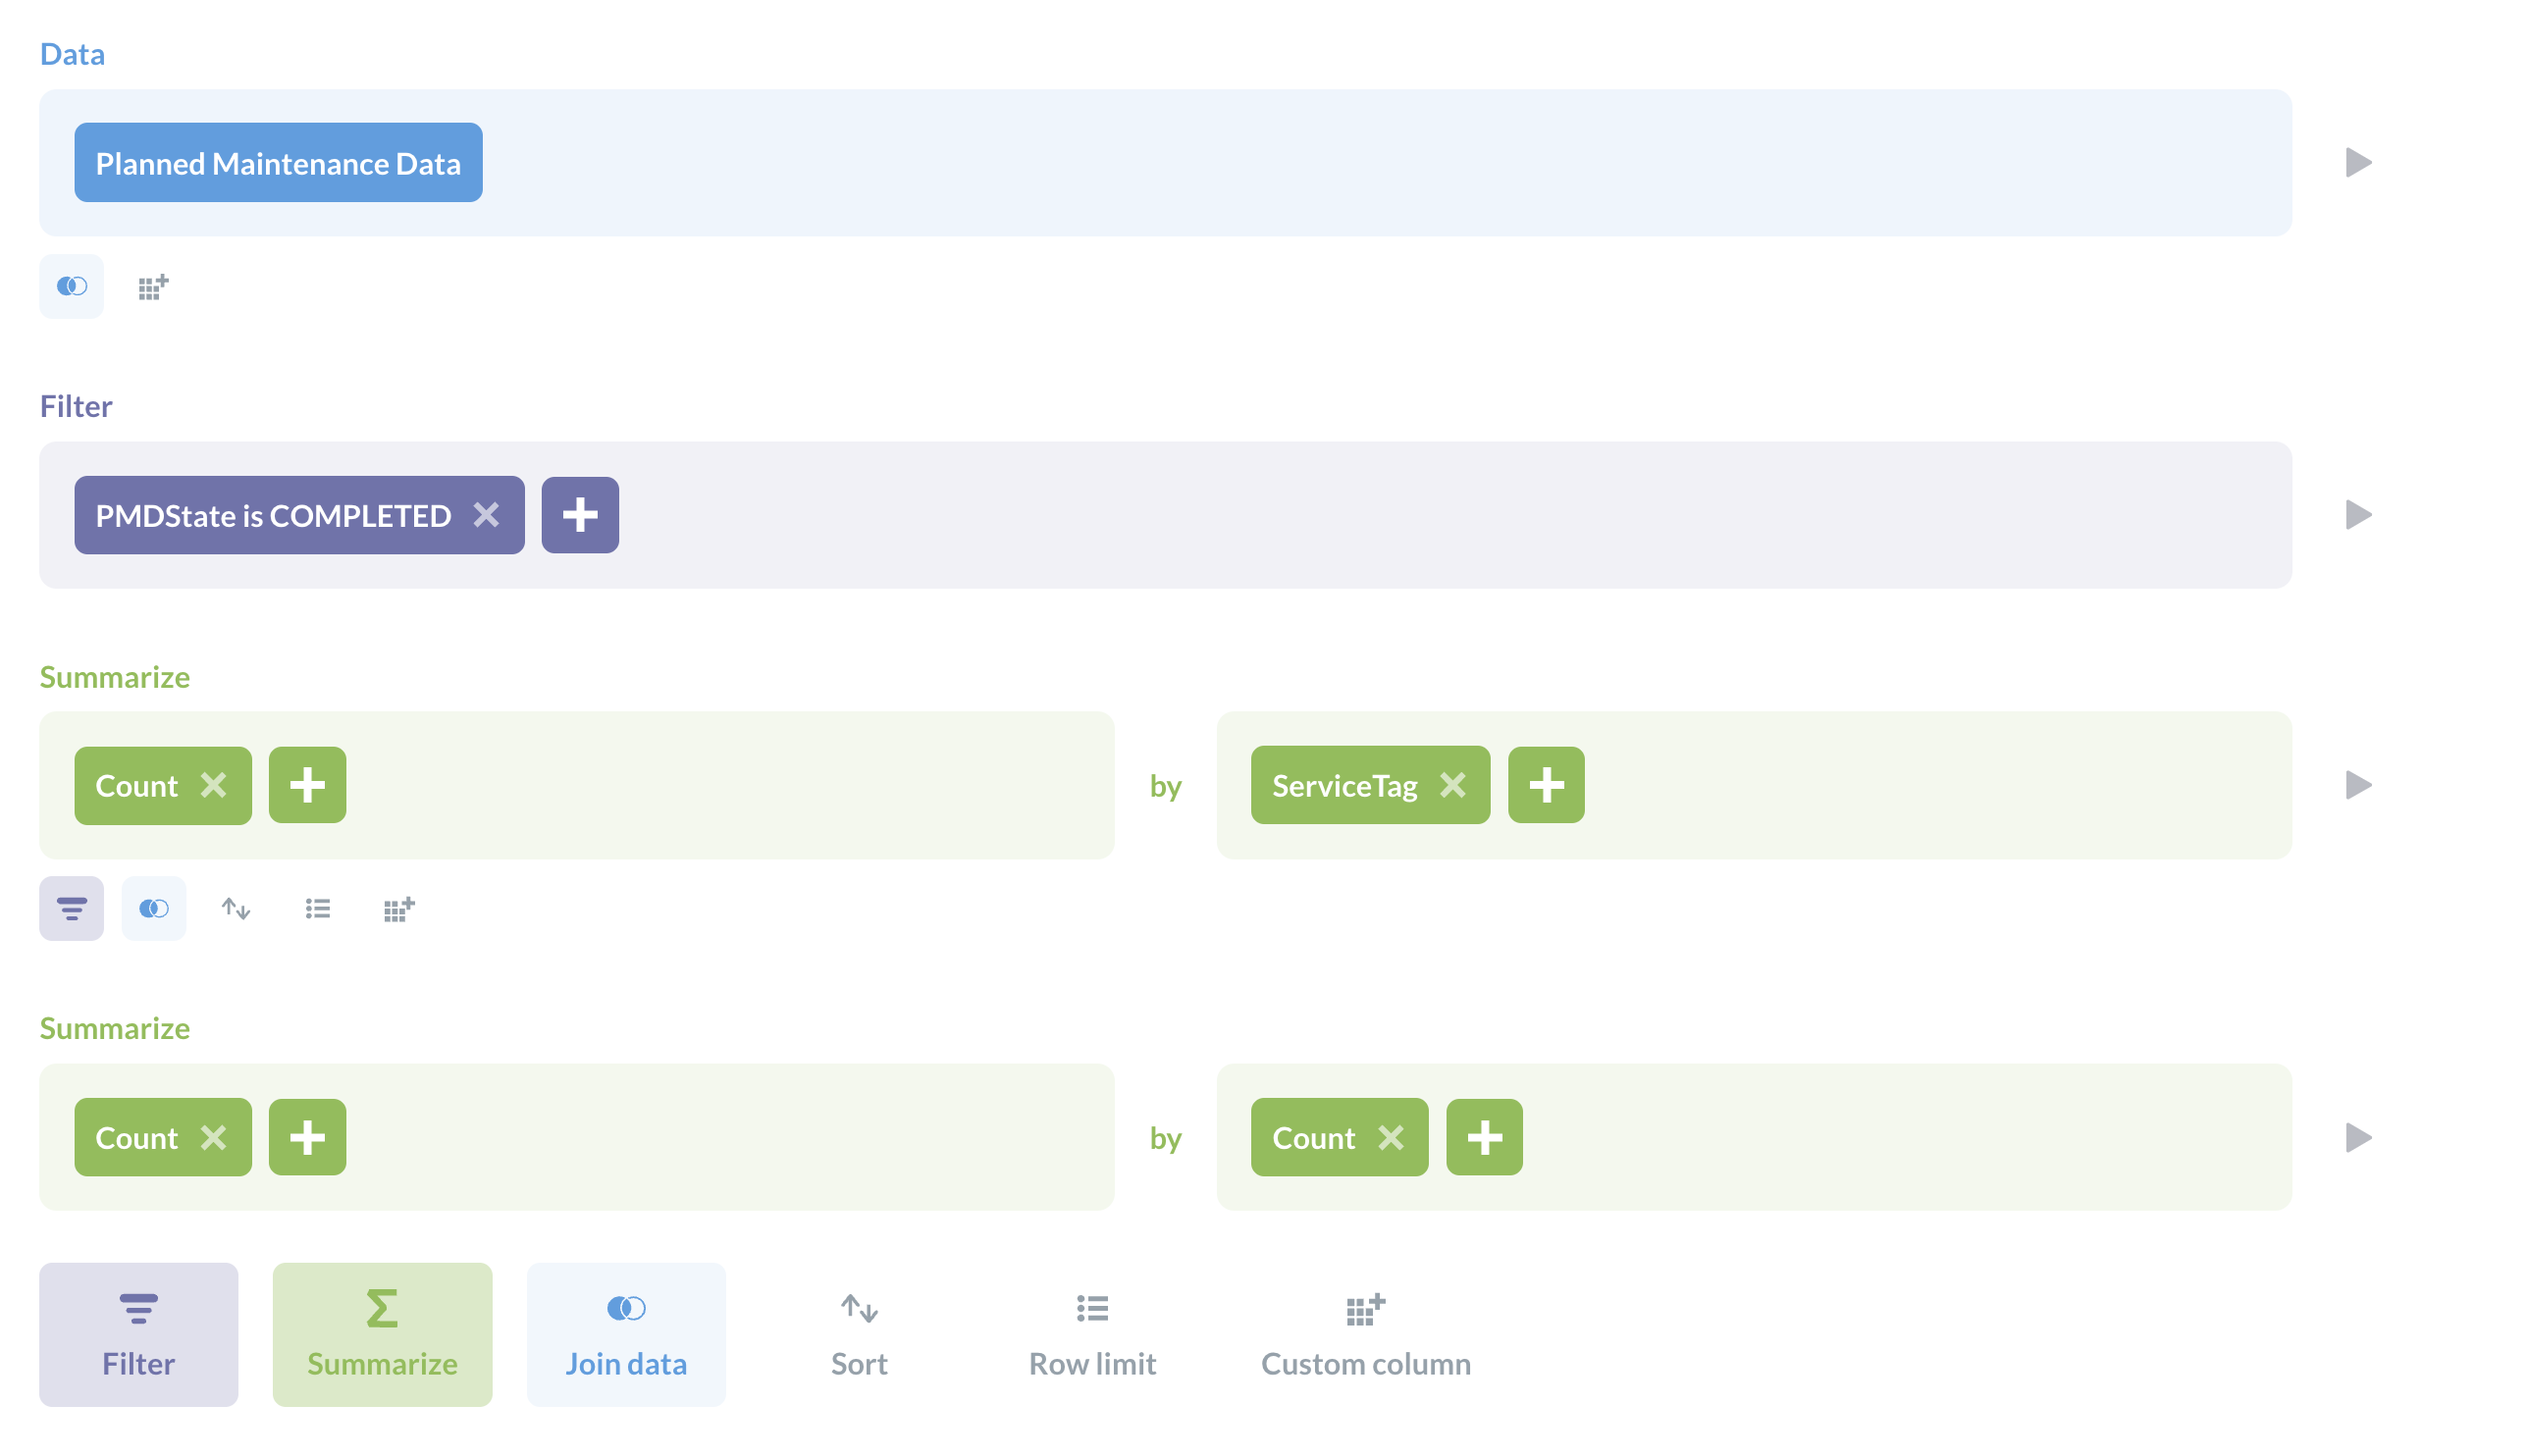
I’m using Dashboard filters often. But I have a query where I calculate cumulative sum of a distinct count of a specific field in a result set grouped by date (weeks). This is done with a two stage summary.
This is possible to put in a Metabase query, but if I add a filter to this query from a dashboard, then the filter is applied on the first result set - so after the first summary - instead of on the initial query data. Which means the filter is not working.
Is there someone who knows how to resolve this? Could it be added to the Metabase features?
Let’s say I have a table with transactions. The records have four columns: from, to, transaction, timestamp.
Users can have multiple transactions. But I would like to have a count of the distinct number of “from”-values per week so I can see how many users actually did a transaction. That’s the first grouping. Then I group again to have the cumulative count of distinct “from”-values. Again per week.
This is perfectly possible in the query view.
But let’s say I use this query as a basis for a dashboard and now I would like to filter the “to”-column with a dashboard filter, so I can have the same query run for a specific destination of transactions.
This is currently not possible, because the filter is automatically applied on the result of the first grouping instead of on the initial data…
Your github-issues do not mention this problem, so I don’t really see why they’re relevant.
@neeohw I still don’t understand, so perhaps some screenshots or examples of how you’re doing what you want in Query Browser.
It sounds like you almost want the functionality from QB on the dashboard.
Now, from the dashboard, if i need to apply the filter on 3rd column. It wont work after second summary. It is accessible till the first summary. That is the issue. How to solve this.
I m talking about the dynamic filter in the dashboard. I can create filters on first selection, but if the column got 100 unique values, cannot create 100 different question right? If it can be filtered in the dashboard, a single chart can be used to get whatever value i need.
I am also struggling with this issue. Some of my colleagues are not familiar with writing SQL queries and thus cannot add the filter at the correct aggregation level.
Could you tell me if we can expect a fix so that the filter can be applied at any aggregation level (and not just the last one)?
it's something that we didn't consider in the very beginning and now we're rewriting our query processor and libraries to make this happen. Please upvote the issue in our github issue tracker so we can prioritize this, thanks
 on the first post of each issue: