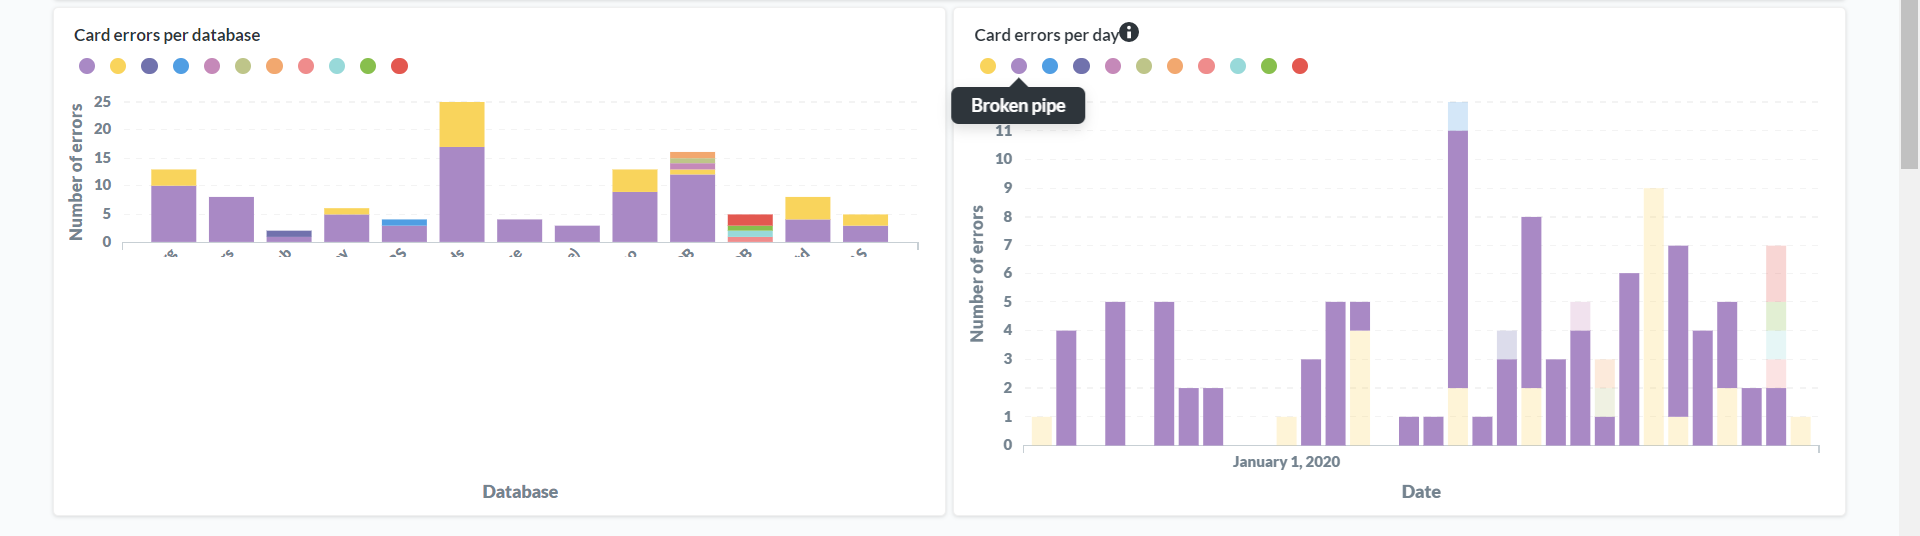
We are currently experiencing an issue with the display of charts on our dashboards, where seemingly randomly the chart will display the message “There was a problem displaying this chart” rather than rendering correctly. If we refresh the dashboard, we might then see the chart render correctly but another chart that was rendering will now show the error message.
I thought we had been experiencing issue #9989 so we upgraded to v0.33.4 but we are unfortunately still seeing it so perhaps it’s a different issue after all, especially as it doesn’t look like anyone else has reported this since 0.33.4 was released a month ago.
The steps to reproduce are browse to a dashboard, then if any of the charts show the error message, refresh the page and hope that they render correctly.
We see the issue more often at the start of the day when the system hasn’t had recent usage and less so after recent use.
Diagnostic Info:
{
  "browser-info": {
    "language": "en-US",
    "platform": "MacIntel",
    "userAgent": "Mozilla/5.0 (Macintosh; Intel Mac OS X 10_15_0) AppleWebKit/537.36 (KHTML, like Gecko) Chrome/78.0.3904.70 Safari/537.36",
    "vendor": "Google Inc."
  },
  "system-info": {
    "java.runtime.name": "OpenJDK Runtime Environment",
    "java.runtime.version": "11.0.4+11-post-Ubuntu-1ubuntu218.04.3",
    "java.vendor": "Ubuntu",
    "java.vendor.url": "https://ubuntu.com/",
    "java.version": "11.0.4",
    "java.vm.name": "OpenJDK 64-Bit Server VM",
    "java.vm.version": "11.0.4+11-post-Ubuntu-1ubuntu218.04.3",
    "os.name": "Linux",
    "os.version": "4.15.0-66-generic",
    "user.language": "en",
    "user.timezone": "Etc/UTC"
  },
  "metabase-info": {
    "databases": [
      "mysql"
    ],
    "hosting-env": "unknown",
    "application-database": "mysql",
    "run-mode": "prod",
    "version": {
      "date": "2019-10-07",
      "tag": "v0.33.4",
      "branch": "release-0.33.x",
      "hash": "9559406"
    },
    "settings": {
      "report-timezone": "Pacific/Auckland"
    }
  }
}
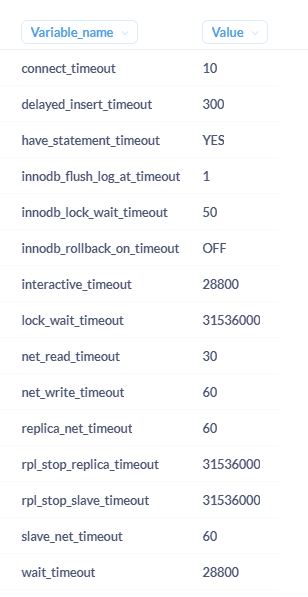
MySQL version: 5.6
Logs when we see a failure to render a chart on a dashboard:
[8bbe9ca1-41f3-4123-9f9f-9ded945e3b17] 2019-11-11T13:34:38+13:00 DEBUG metabase.middleware.log POST /api/card/286/query 200 [ASYNC: completed] 662.1 ms (11 DB calls) Jetty threads: 3/50 (12 idle, 0 queued) (140 total active threads) Queries in flight: 14
[8bbe9ca1-41f3-4123-9f9f-9ded945e3b17] 2019-11-11T13:34:38+13:00 ERROR metabase.middleware.log POST /api/card/140/query 500 9.2 ms (2 DB calls)
{:message "(conn=46284) Broken pipe (Write failed)",
:type java.sql.SQLNonTransientConnectionException,
:stacktrace
("org.mariadb.jdbc.internal.util.exceptions.ExceptionMapper.get(ExceptionMapper.java:234)"
"org.mariadb.jdbc.internal.util.exceptions.ExceptionMapper.getException(ExceptionMapper.java:165)"
"org.mariadb.jdbc.MariaDbStatement.executeExceptionEpilogue(MariaDbStatement.java:238)"
"org.mariadb.jdbc.MariaDbPreparedStatementClient.executeInternal(MariaDbPreparedStatementClient.java:232)"
"org.mariadb.jdbc.MariaDbPreparedStatementClient.execute(MariaDbPreparedStatementClient.java:159)"
"org.mariadb.jdbc.MariaDbPreparedStatementClient.executeQuery(MariaDbPreparedStatementClient.java:174)"
"com.mchange.v2.c3p0.impl.NewProxyPreparedStatement.executeQuery(NewProxyPreparedStatement.java:431)"
"clojure.java.jdbc$execute_query_with_params.invokeStatic(jdbc.clj:1072)"
"clojure.java.jdbc$execute_query_with_params.invoke(jdbc.clj:1066)"
"clojure.java.jdbc$db_query_with_resultset_STAR_.invokeStatic(jdbc.clj:1095)"
"clojure.java.jdbc$db_query_with_resultset_STAR_.invoke(jdbc.clj:1075)"
"clojure.java.jdbc$query.invokeStatic(jdbc.clj:1164)"
"clojure.java.jdbc$query.invoke(jdbc.clj:1126)"
"toucan.db$query.invokeStatic(db.clj:285)"
"toucan.db$query.doInvoke(db.clj:281)"
"clojure.lang.RestFn.invoke(RestFn.java:410)"
"toucan.db$simple_select.invokeStatic(db.clj:391)"
"toucan.db$simple_select.invoke(db.clj:380)"
"toucan.db$select.invokeStatic(db.clj:659)"
"toucan.db$select.doInvoke(db.clj:653)"
"clojure.lang.RestFn.applyTo(RestFn.java:139)"
"clojure.core$apply.invokeStatic(core.clj:667)"
"clojure.core$apply.invoke(core.clj:660)"
"toucan.db$select_field.invokeStatic(db.clj:682)"
"toucan.db$select_field.doInvoke(db.clj:674)"
"clojure.lang.RestFn.applyTo(RestFn.java:142)"
"clojure.core$apply.invokeStatic(core.clj:669)"
"clojure.core$apply.invoke(core.clj:660)"
"toucan.db$select_ids.invokeStatic(db.clj:692)"
"toucan.db$select_ids.doInvoke(db.clj:685)"
"clojure.lang.RestFn.invoke(RestFn.java:439)"
"--> models.collection$fn__32818$descendant_ids__32823$fn__32824.invoke(collection.clj:429)"
"models.collection$fn__32818$descendant_ids__32823.invoke(collection.clj:426)"
"models.collection$fn__33619$user__GT_personal_collection_and_descendant_ids__33624$fn__33625.invoke(collection.clj:1063)"
"models.collection$fn__33619$user__GT_personal_collection_and_descendant_ids__33624.invoke(collection.clj:1053)"
"models.user$permissions_set.invokeStatic(user.clj:283)"
"models.user$permissions_set.invoke(user.clj:277)"
"middleware.session$do_with_current_user$fn__47524.invoke(session.clj:175)"
"models.interface$current_user_permissions_set.invokeStatic(interface.clj:237)"
"models.interface$current_user_permissions_set.invoke(interface.clj:237)"
"models.interface$make_perms_check_fn$_has_perms_QMARK___27820.invoke(interface.clj:252)"
"models.interface$make_perms_check_fn$_has_perms_QMARK___27820.invoke(interface.clj:250)"
"models.interface$fn__27743$fn__27752$G__27746__27761.invoke(interface.clj:184)"
"api.common$read_check.invokeStatic(common.clj:346)"
"api.common$read_check.invoke(common.clj:339)"
"api.card$run_query_for_card_async.invokeStatic(card.clj:609)"
"api.card$run_query_for_card_async.doInvoke(card.clj:601)"
"api.card$fn__60921$fn__60924.invoke(card.clj:623)"
"api.card$fn__60921.invokeStatic(card.clj:622)"
"api.card$fn__60921.invoke(card.clj:618)"
"middleware.auth$enforce_authentication$fn__47314.invoke(auth.clj:14)"
"routes$fn__66170$fn__66171.doInvoke(routes.clj:56)"
"middleware.exceptions$catch_uncaught_exceptions$fn__47270.invoke(exceptions.clj:104)"
"middleware.exceptions$catch_api_exceptions$fn__47267.invoke(exceptions.clj:92)"
"middleware.log$log_api_call$fn__47180$fn__47181.invoke(log.clj:170)"
"middleware.log$log_api_call$fn__47180.invoke(log.clj:164)"
"middleware.security$add_security_headers$fn__47231.invoke(security.clj:122)"
"middleware.json$wrap_json_body$fn__47397.invoke(json.clj:61)"
"middleware.json$wrap_streamed_json_response$fn__47415.invoke(json.clj:97)"
"middleware.session$bind_current_user$fn__47529$fn__47530.invoke(session.clj:193)"
"middleware.session$do_with_current_user.invokeStatic(session.clj:176)"
"middleware.session$do_with_current_user.invoke(session.clj:170)"
"middleware.session$bind_current_user$fn__47529.invoke(session.clj:192)"
"middleware.session$wrap_current_user_id$fn__47518.invoke(session.clj:161)"
"middleware.session$wrap_session_id$fn__47503.invoke(session.clj:123)"
"middleware.auth$wrap_api_key$fn__47322.invoke(auth.clj:27)"
"middleware.misc$maybe_set_site_url$fn__47295.invoke(misc.clj:56)"
"middleware.misc$bind_user_locale$fn__47298.invoke(misc.clj:72)"
"middleware.misc$add_content_type$fn__47283.invoke(misc.clj:28)"
"middleware.misc$disable_streaming_buffering$fn__47306.invoke(misc.clj:87)"),
:sql-exception-chain ["SQLNonTransientConnectionException:" "Message: (conn=46284) Broken pipe (Write failed)" "SQLState: 08" "Error Code: 0"]}

[8bbe9ca1-41f3-4123-9f9f-9ded945e3b17] 2019-11-11T13:34:38+13:00 INFO metabase.query-processor.middleware.cache Query took 618 ms to run; miminum for cache eligibility is 60000 ms
[8bbe9ca1-41f3-4123-9f9f-9ded945e3b17] 2019-11-11T13:34:38+13:00 DEBUG metabase.middleware.log POST /api/card/30/query 200 [ASYNC: completed] 718.4 ms (12 DB calls) Jetty threads: 2/50 (13 idle, 0 queued) (140 total active threads) Queries in flight: 13
Please let me know if there’s anything else I can provide you with. Love your work!