Hello Metabase team,
I am experiencing what I believe to be a bug, as I am puzzling as to why I am getting a "Sorry, you don’t have permission to see that." error screen despite all of the corresponding collections and data permissions settings being applied in the Admin panel.
Here is the background:
I have a user group (let's call it Company) which has the exact same permissions as the default All Users group (where everything is revoked, i.e. "No Access") with the exception of having "View" access for one collection that contains very high-level questions about the company's KPIs and its accompanying Dashboard. Here is a screenshot for reference:
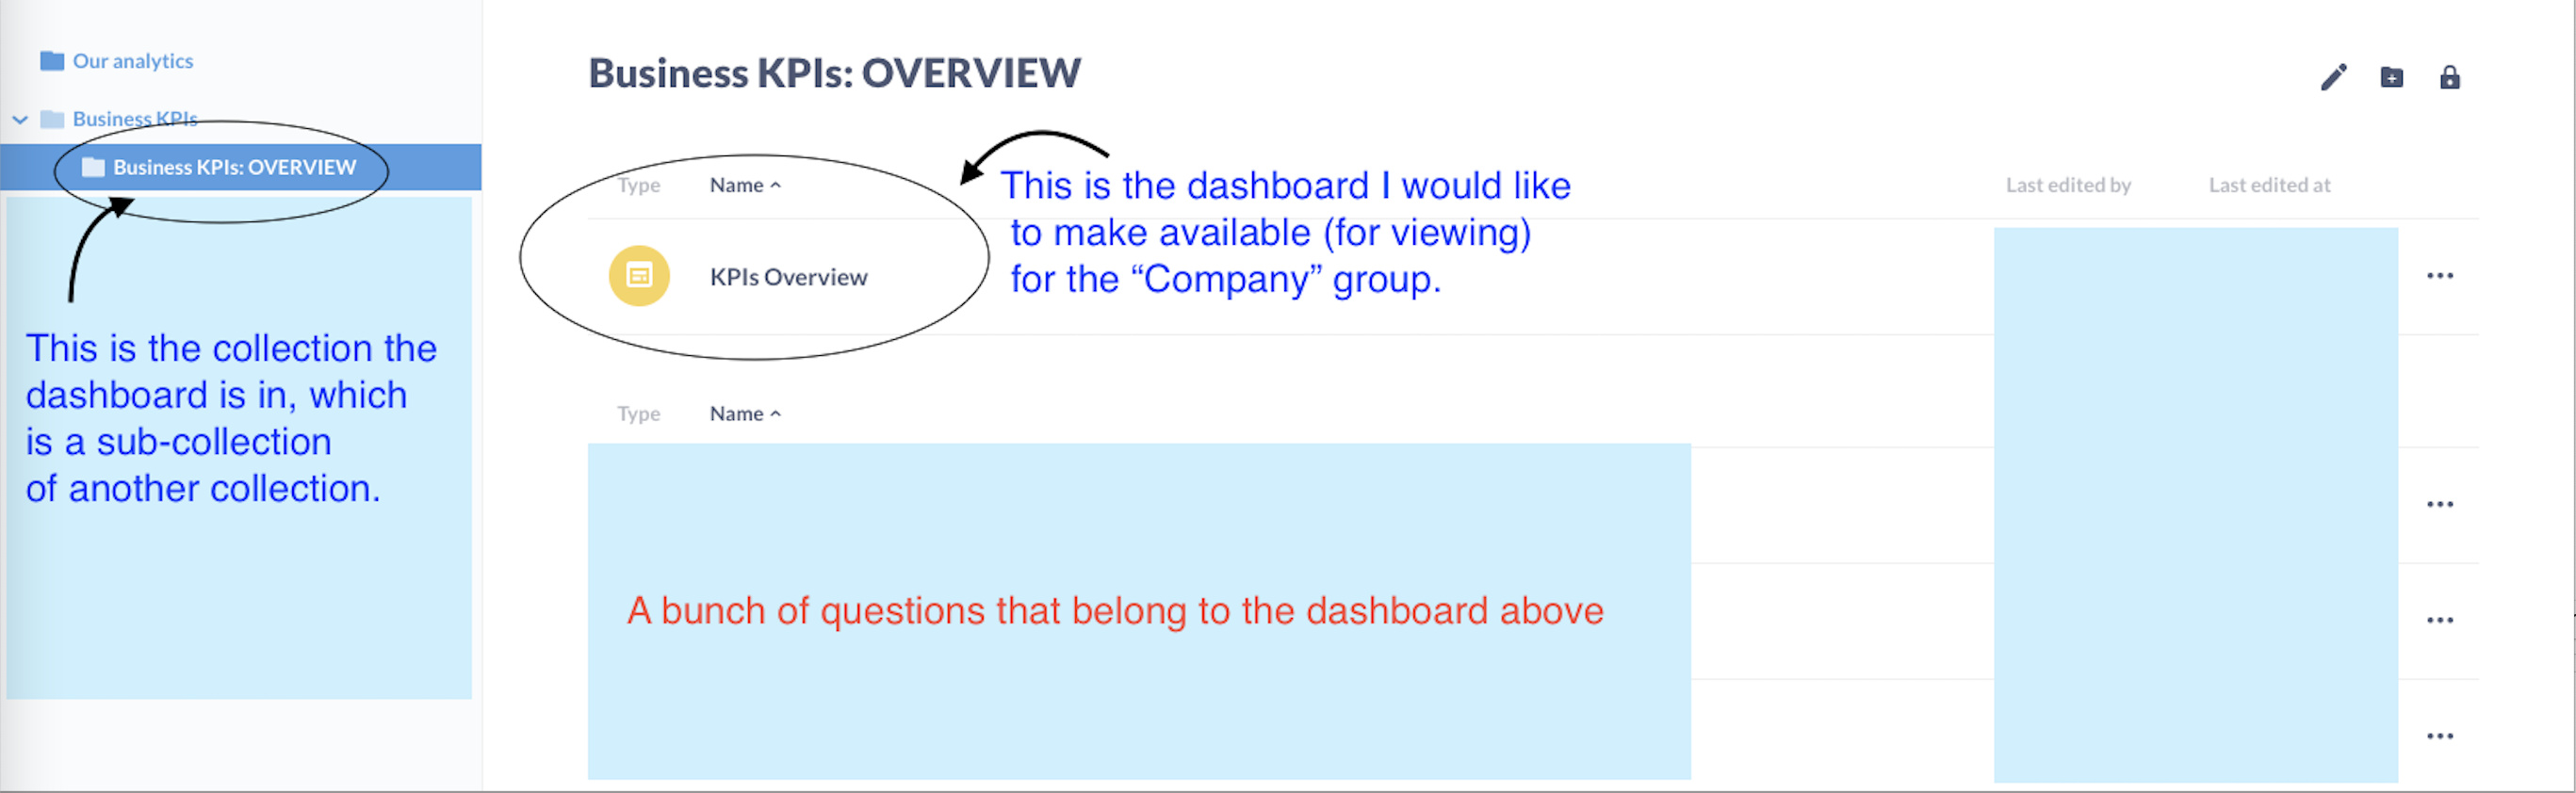
So what I did was create a test user in our Metabase application that is in the Company group, which only has access to this specific collection, as well as access to the underlying materialized views that these questions are querying from. It is worth noting that the questions in this collection are querying from 2 different materialized views (also in different schemas), but I made sure that this group has access to both of them.
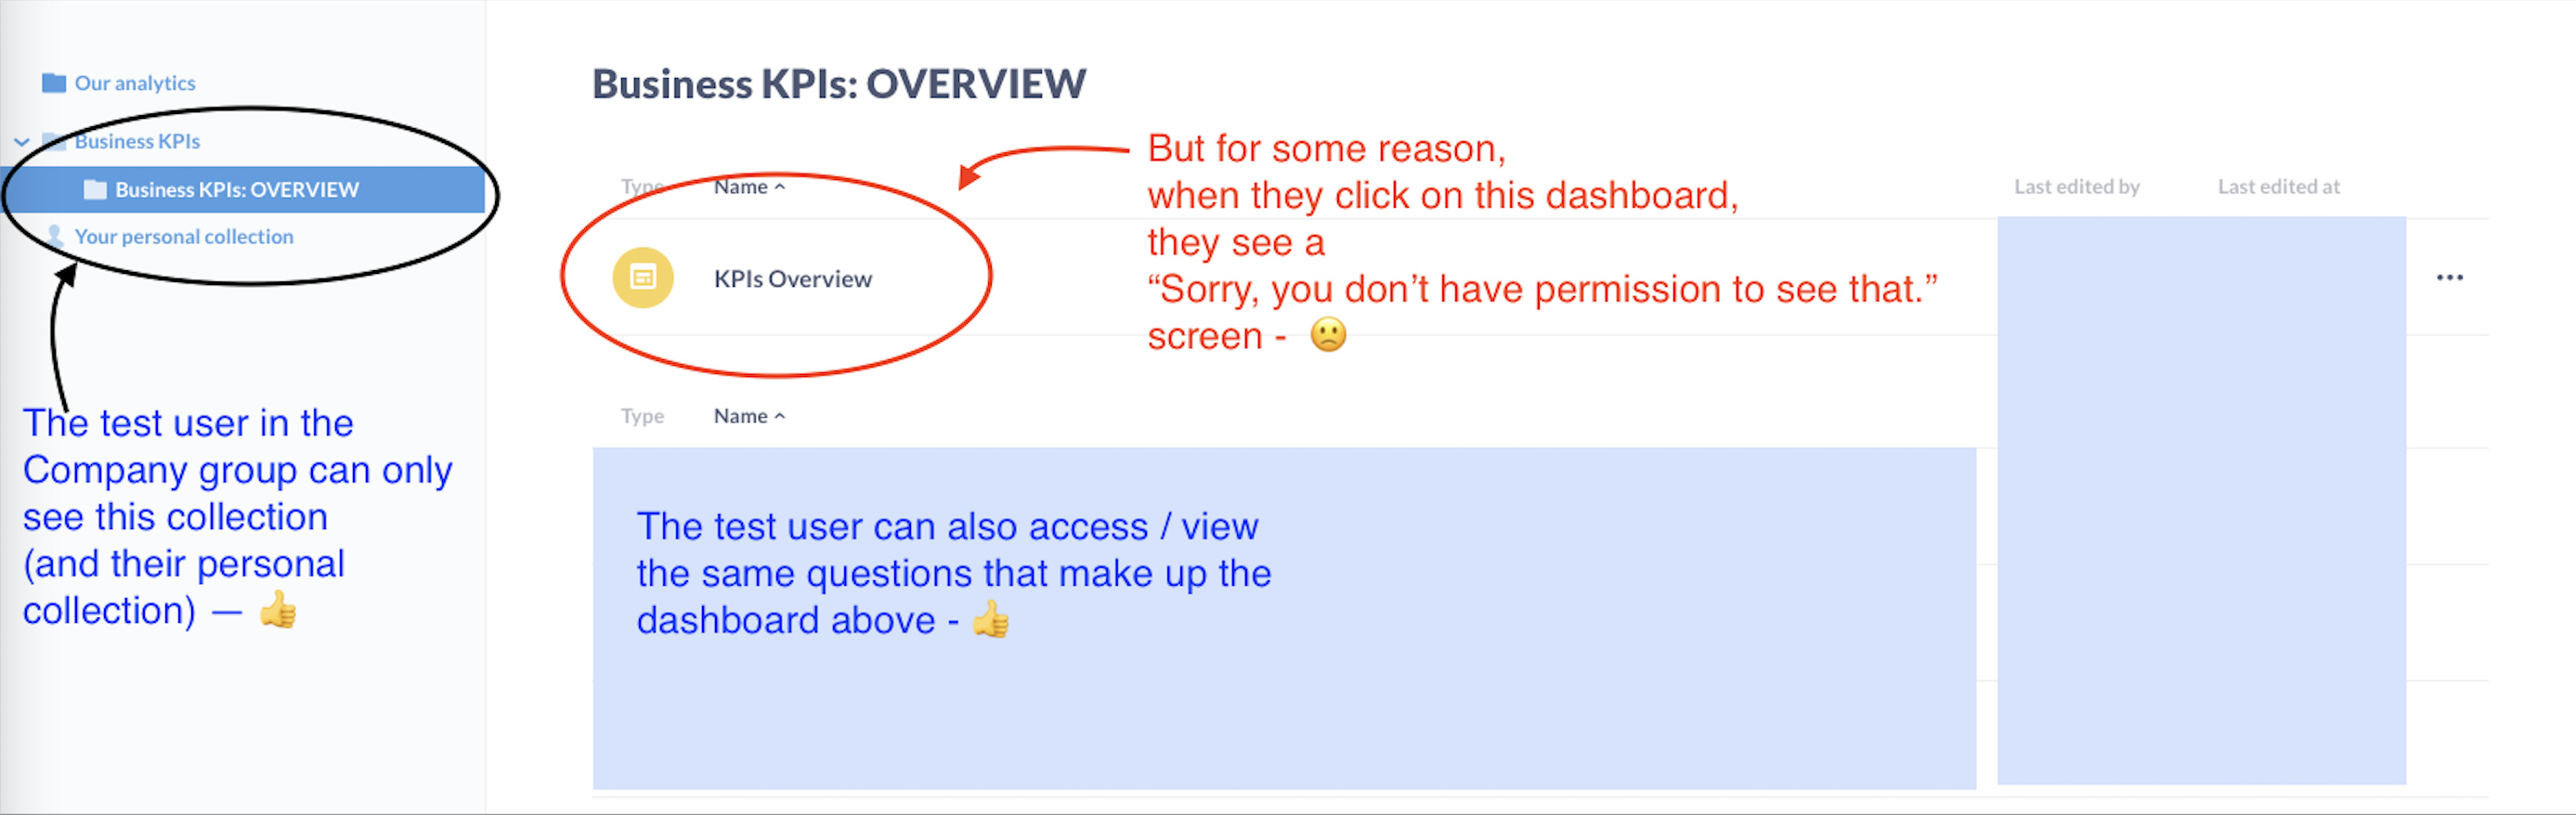
As expected, when I log in as that user, they can only view that collection, and inside that collection, they can view all the individual questions (able to view the charts and play around with them, regardless of which of the 2 materialized views the data is coming from). So far so good.
HOWEVER, for some reason (explained in more detail below), I get a "Sorry, you don’t have permission to see that." error screen when clicking on the actual dashboard -- even though the user has access to all the underlying charts / questions and data.
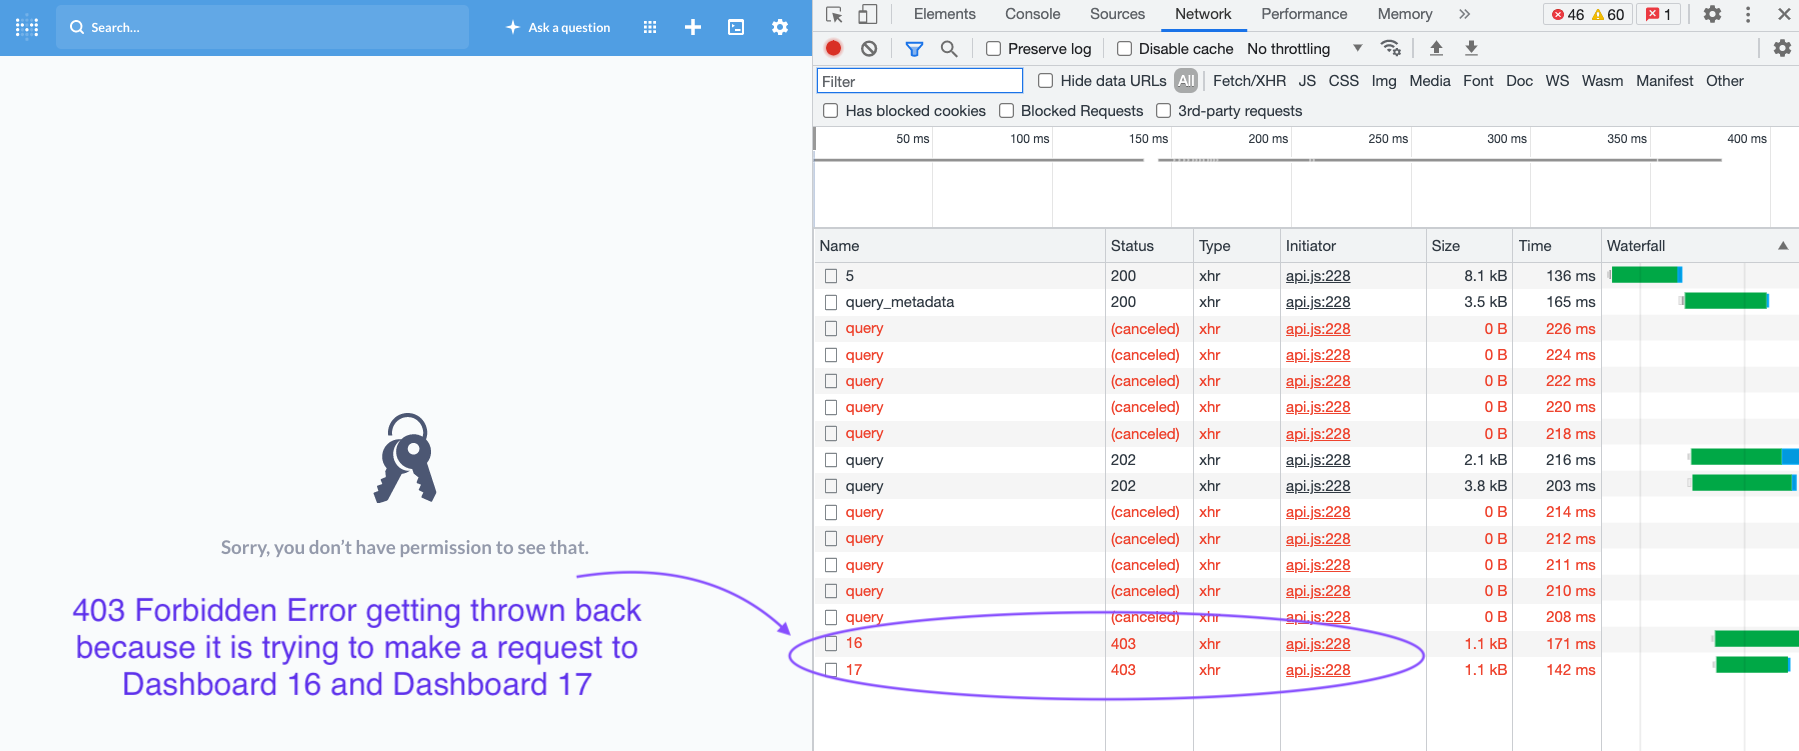
So what is going on under the hood that is throwing that error? I replicated the same step of clicking on the dashboard, but this time examined the Network tab of my developer tools to see what was causing the kickback.
It appears that the problem is that when the test user clicks on the dashboard (which they SHOULD be able to view), it is making a request to TWO OTHER dashboards (which they intentionally do NOT have access to) -- /api/dashboard/16 & /api/dashboard/17 -- which seem to be triggering 403 errors and thus cancelling the request for the rest of the page, as seen in the screenshot below:
At this point, I tried digging a bit deeper into where exactly these requests are being made, though I am not an expert in web-dev / networking so I could only get so far, and perhaps I am missing something simple here.
However, the bigger issue that is puzzling me is why? Why is the mere act of clicking on a permitted dashboard (which is dashboard 5, for reference) sending a request to 2 other unrelated dashboards, which are in collections that the user does not (and should not) have access to? At this point I triple-checked the dashboard to see if there are any traces of anything pointing to those other 2 dashboards (e.g. hyperlinks, questions accidentally coming from other collections), but I confirmed that no such linkage / association exists.
Plus, even if that were the case, my understanding from the Metabase documentation is that if a dashboard has things that are coming from other collections that a user does not have access to, then the dashboard should still load, but just hide the specific elements on the screen that they don't have access to.
This all leads me to believe that there is some weird glitch going on underneath the hood that I simply do not understand. I could try to re-arrange some of the collections / dashboard to perhaps organize them in such a way that these automatic requests / re-routes are no longer an issue, but that would be less than ideal, and I would more importantly like to understand what is going on that is causing this behavior to begin with.
I would really appreciate any help / guidance you can provide me, and I am more than happy to provide any other screenshots / info that you need to help me debug this.
Diagnostic Info, for reference:
{
  "browser-info": {
    "language": "en-GB",
    "platform": "MacIntel",
    "userAgent": "Mozilla/5.0 (Macintosh; Intel Mac OS X 10_15_7) AppleWebKit/537.36 (KHTML, like Gecko) Chrome/93.0.4577.63 Safari/537.36",
    "vendor": "Google Inc."
  },
  "system-info": {
    "file.encoding": "UTF-8",
    "java.runtime.name": "OpenJDK Runtime Environment",
    "java.runtime.version": "11.0.12+7",
    "java.vendor": "Eclipse Foundation",
    "java.vendor.url": "https://adoptium.net/",
    "java.version": "11.0.12",
    "java.vm.name": "OpenJDK 64-Bit Server VM",
    "java.vm.version": "11.0.12+7",
    "os.name": "Linux",
    "os.version": "5.4.0-70-generic",
    "user.language": "en",
    "user.timezone": "GMT"
  },
  "metabase-info": {
    "databases": [
      "postgres"
    ],
    "hosting-env": "unknown",
    "application-database": "h2",
    "application-database-details": {
      "database": {
        "name": "H2",
        "version": "1.4.197 (2018-03-18)"
      },
      "jdbc-driver": {
        "name": "H2 JDBC Driver",
        "version": "1.4.197 (2018-03-18)"
      }
    },
    "run-mode": "prod",
    "version": {
      "date": "2021-10-06",
      "tag": "v0.41.0",
      "branch": "release-x.41.x",
      "hash": "c529fe2"
    },
    "settings": {
      "report-timezone": null
    }
  }
}
Additionally, I am querying PostgreSQL 12.2 (Ubuntu 12.2-4).
I am also still using the default H2 database for the dashboard data, but am in the process of switching to a separate Postgres instance for that this week. I would be surprised if that were the problem, but it might still be relevant mentioning.
 on the first post