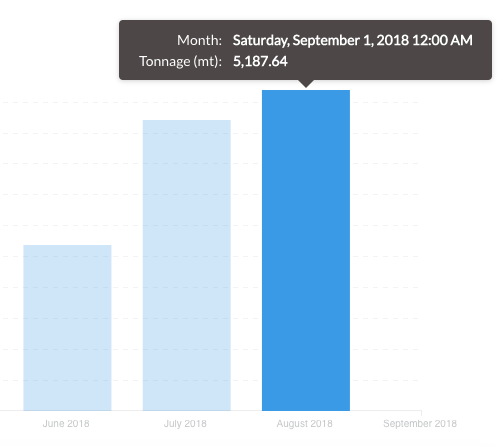
This just started happening today without any changes to setup of question. For Bar, Line, Area visualization types, my data by month appears in the previous month than it is supposed to. For other visualization types it is fine. Anyone know what's up?