Hi,
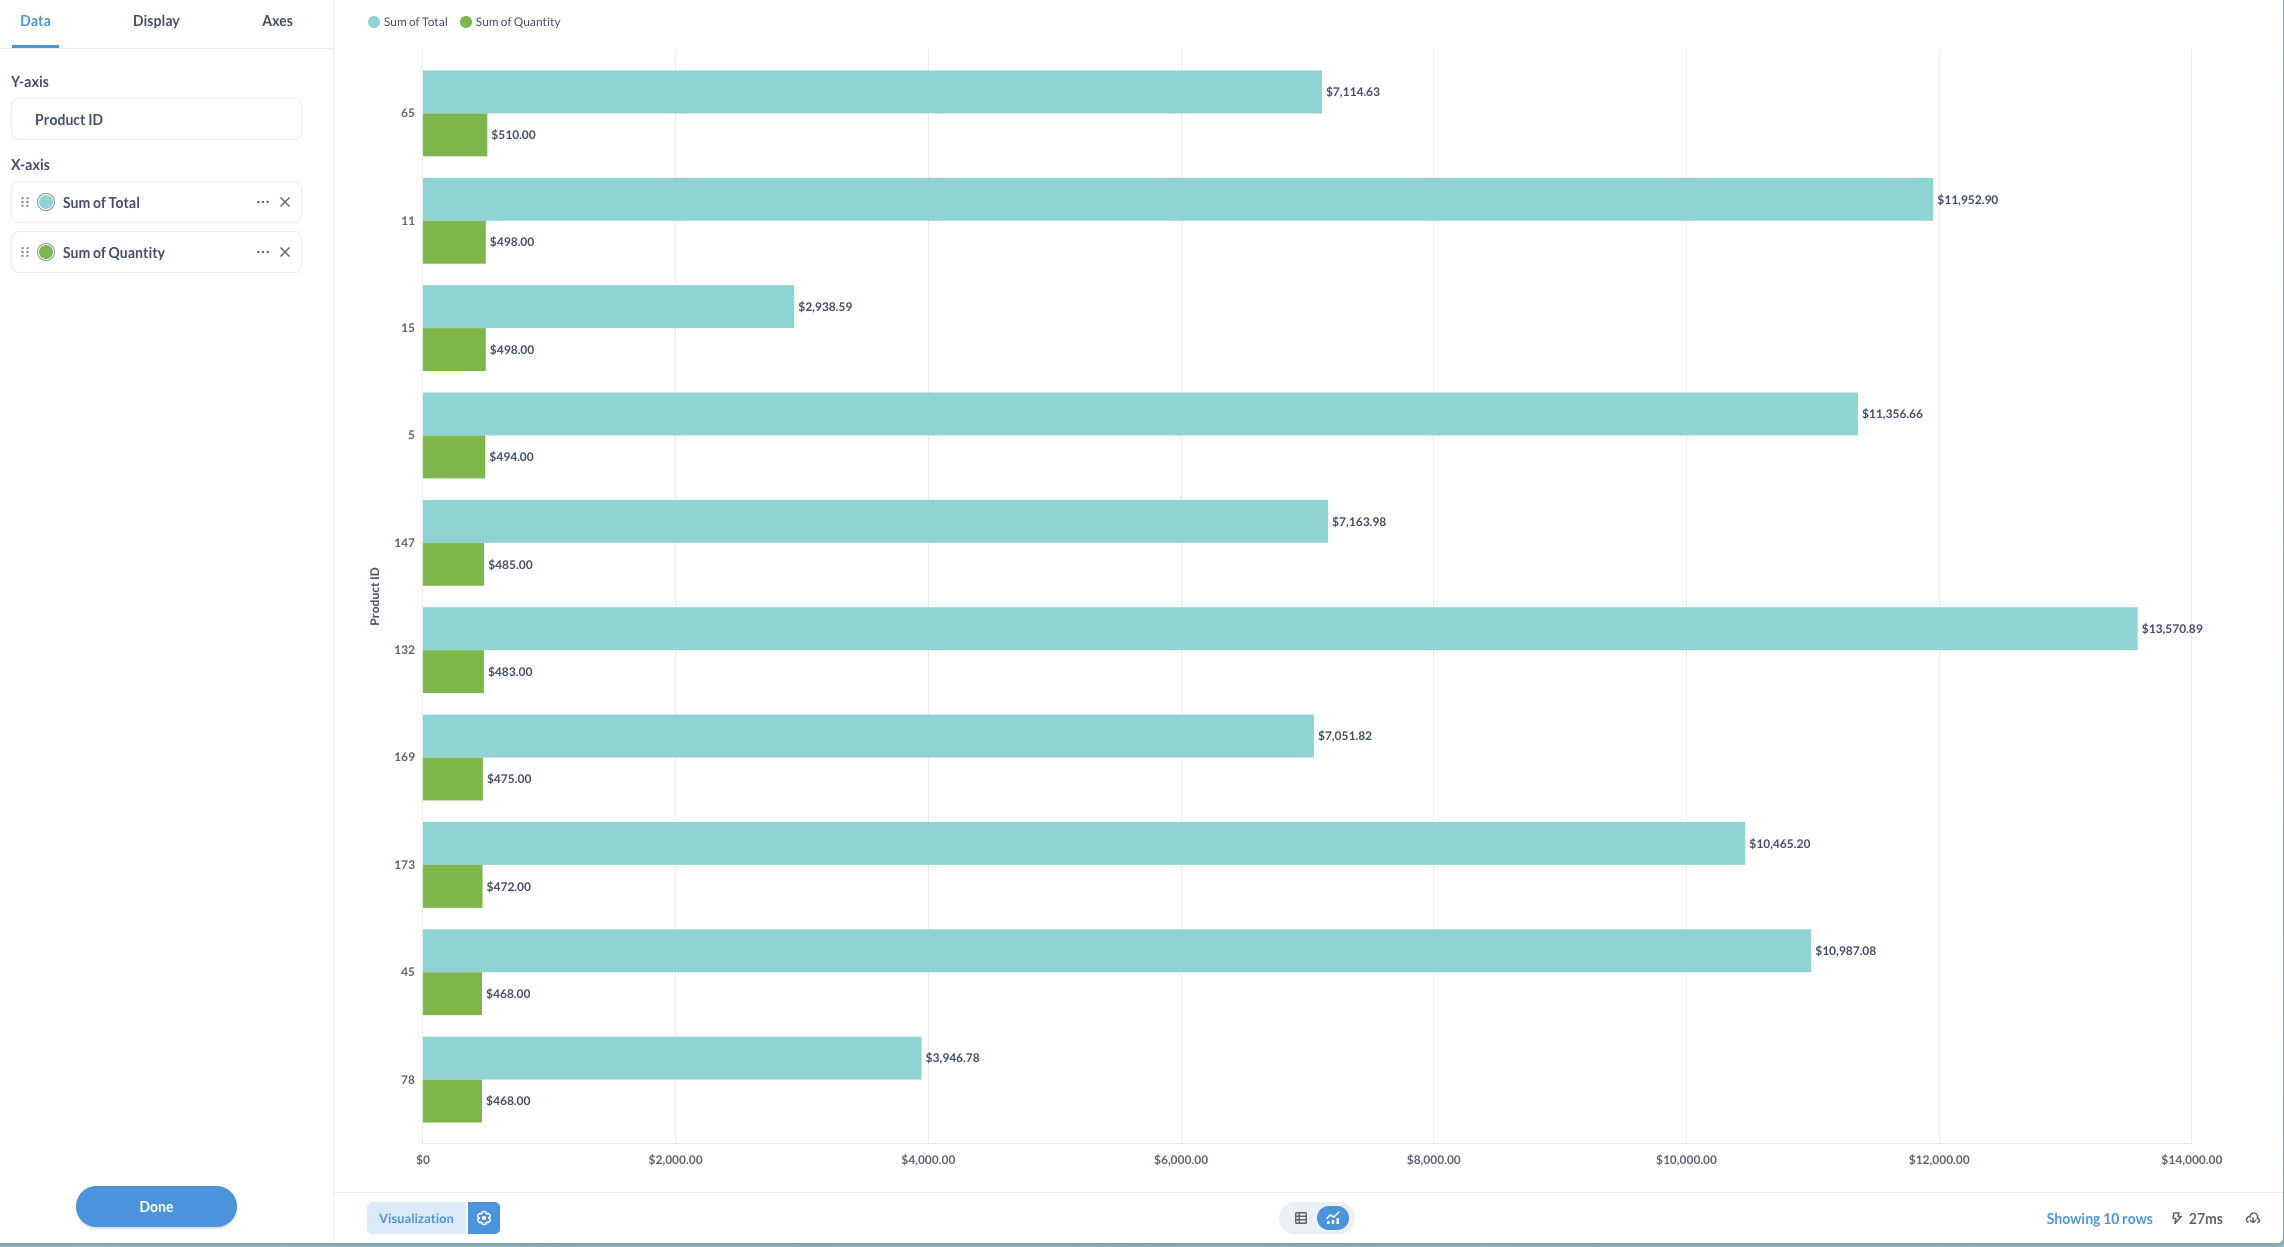
I’m trying to display 2 metrics with different types in a row chart, visualizing the values of each column. One metric is a currency, the other a number. It works well if I use the Bar chart, but if I use the Row chart, all the values are displayed with the type of the 1st series in the row axis. The table metadata is properly defined, and it ignores any changes I make to the formatting option on the series.
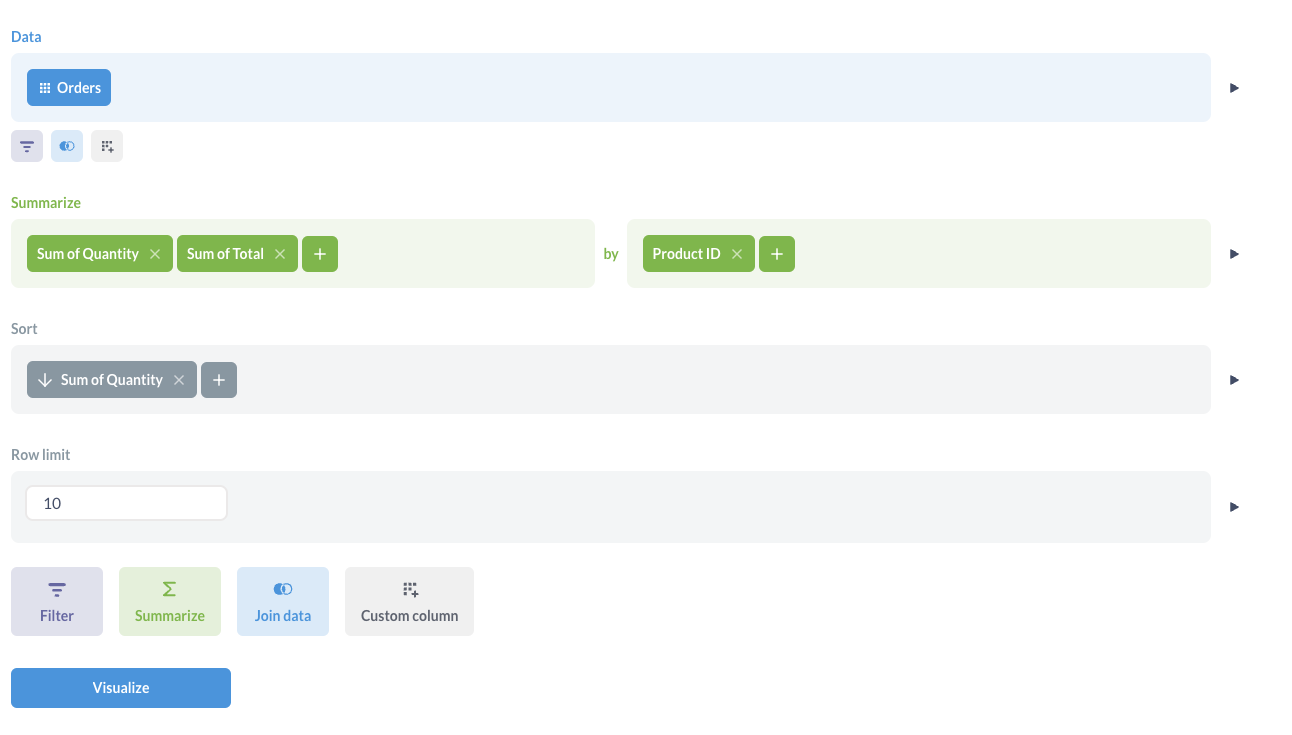
Here’s a reproducible example of the issue using the sample database:
Is this expected? Is there a workaround to solve it? Can you, please, make it work properly?
Thanks,