Hi, when i plot a time series, two weird things can happen:
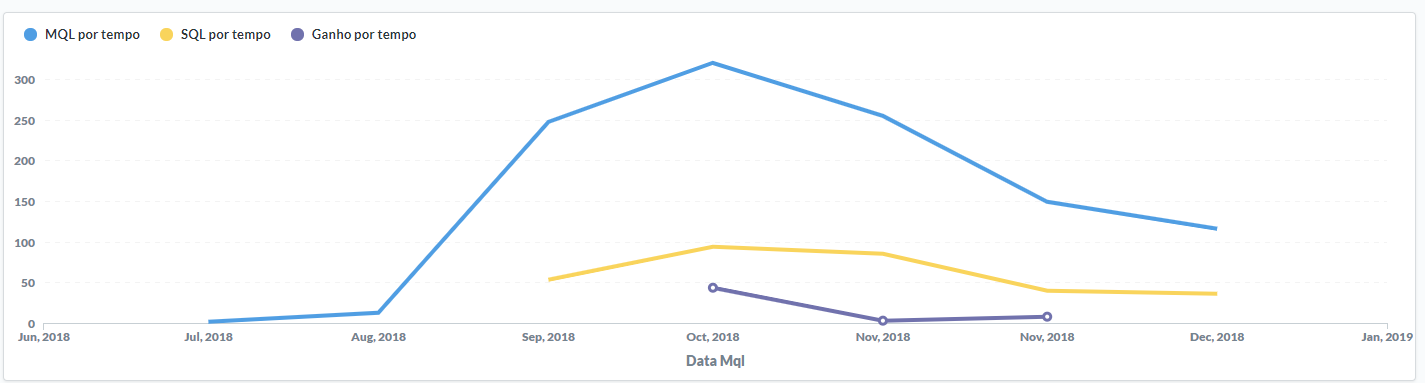
1 - My montlhy date shows November Twice in axis X, but the plot lines are normal:
2 - My montlhy date in axis X is month before the ploted line, when i hover the mouse, I see the months correclty
How can I fix this?
Thanks
Hi @Raefraf
This sounds like an existing bug (go and vote by clicking the :+1 on the first post) :
Or maybe https://github.com/metabase/metabase/issues/5246