How to add a date range filter in the dashboard when the graphs are created using SQL queries?
Hi there!
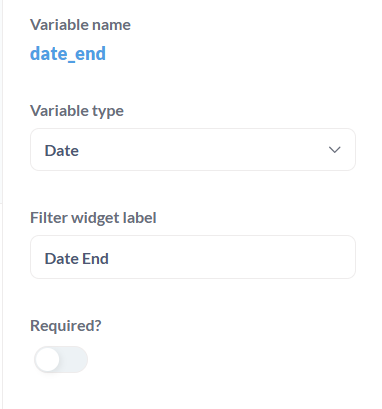
You can achieve this with a Field Filter on the date field, with filter widget type "Date Range"
Yes I tried this approach, but when there are two filters, one date and another category then its not working in case where we are using SQL query to design a graph
Multiple field filters should work normally, are you getting an error? If so, could you share the error and the query you're trying to run?