Hello everyone.
I am investigating a performance issue we have with our Metabase instance. From the logs, I can see that a particular datasource (we have 40+ data sources) is highly used, all 15 connections are occupied.
May 21 16:38:33 metabase metabase[5364]: 05-21 16:38:33 #033[1mDEBUG middleware.log#033[0m :: #033[32mGET /api/collection/4384 200 2.3 s (4 DB calls) App DB connections: 15/15 Jetty threads: 278/1,000 (20 idle, 0 queued) (2,805 total active threads) Queries in flight
Any idea how to identify which datasource is having this issue?
Thanks
Hi @canhduong
No, “App DB connections” are the amount of connections to the Metabase application database (H2, Postgres or MySQL). That is caused by a lot of user activity.
You should allow more connections:
https://github.com/metabase/metabase/blob/6f271dbe7ec7598b6878dcdede88ffdfc68dcaac/docs/operations-guide/environment-variables.md#MB_APPLICATION_DB_MAX_CONNECTION_POOL_SIZE
And possibly look into scaling horizontally by having multiple instance.
Hi @flamber, thanks for clarification.
We looked at the possibility to setup multiple instances, but it was blocked by metabase architecture at the time. Are we sure that it's ready now? Can you point me to any docs if you have?
Thanks a lot
@canhduong When did you test and what problems did you encounter?
We haven’t finished writing docs: https://github.com/metabase/metabase/issues/12177
It would help if you gave some specification numbers about your current setup and amount of concurrent users.
Horizontal scaling is not always the solution - sometimes tweaking your current instance is enough.
We were skeptical because we don’t understand how Metabase would behave when having multiple instances and how to avoid duplicate pulses. So we didn’t actually try it.
So we scaled up instead of scaling out, our metabase setup is now 32vCPUs and 180GB RAM. We usually have 300-800 concurrent users. We have done few tweaks to optimise it, example: setting query timeout.
@canhduong
That’s a fairly large instance. Have you noticed performance and memory improvements in 0.35.x?
Do you mind posting “Diagnostic Info” from Admin > Troubleshooting?
When running horizontal scaled setup, each task will only be handled by one instance at the time, so you won’t see duplicate pulses or things like that.
{
“browser-info”: {
“language”: “en-GB”,
“platform”: “MacIntel”,
“userAgent”: “Mozilla/5.0 (Macintosh; Intel Mac OS X 10_15_3) AppleWebKit/537.36 (KHTML, like Gecko) Chrome/81.0.4044.138 Safari/537.36”,
“vendor”: “Google Inc.”
},
“system-info”: {
“file.encoding”: “UTF-8”,
“java.runtime.name”: “OpenJDK Runtime Environment”,
“java.runtime.version”: “11.0.6+10-post-Debian-1bpo91”,
“java.vendor”: “Debian”,
“java.vendor.url”: “https://tracker.debian.org/openjdk-11”,
“java.version”: “11.0.6”,
“java.vm.name”: “OpenJDK 64-Bit Server VM”,
“java.vm.version”: “11.0.6+10-post-Debian-1bpo91”,
“os.name”: “Linux”,
“os.version”: “4.9.0-7-amd64”,
“user.language”: “en”,
“user.timezone”: “UTC”
},
“metabase-info”: {
“databases”: [
“exasol”,
“postgres”,
“bigquery”,
“h2”
],
“hosting-env”: “unknown”,
“application-database”: “postgres”,
“application-database-details”: {
“database”: {
“name”: “PostgreSQL”,
“version”: “9.6.16”
},
“jdbc-driver”: {
“name”: “PostgreSQL JDBC Driver”,
“version”: “42.2.8”
}
},
“run-mode”: “prod”,
“version”: {
“date”: “2020-04-24”,
“tag”: “v0.35.3”,
“branch”: “metabase-v0.35.3”,
“hash”: “01ca8d1”
},
“settings”: {
“report-timezone”: “UTC”
}
}
}
performance has improved, thanks to the slow endpoints fixes. Memory is still a pain for us, our Metabase restarts quite often because it runs out of memory.
Good to know about the scaling out option, I will look into it. Thanks
@canhduong
If users are exporting often to XLSX, then you should see big improvements in 0.36
Running multiple instances might be a way for you to handle restarts without downtime - I know this is just a workaround, since we still need to wrangle the memory monster.
Our users exporting to CSV/XLSX a lot. Looking forward to v0.36
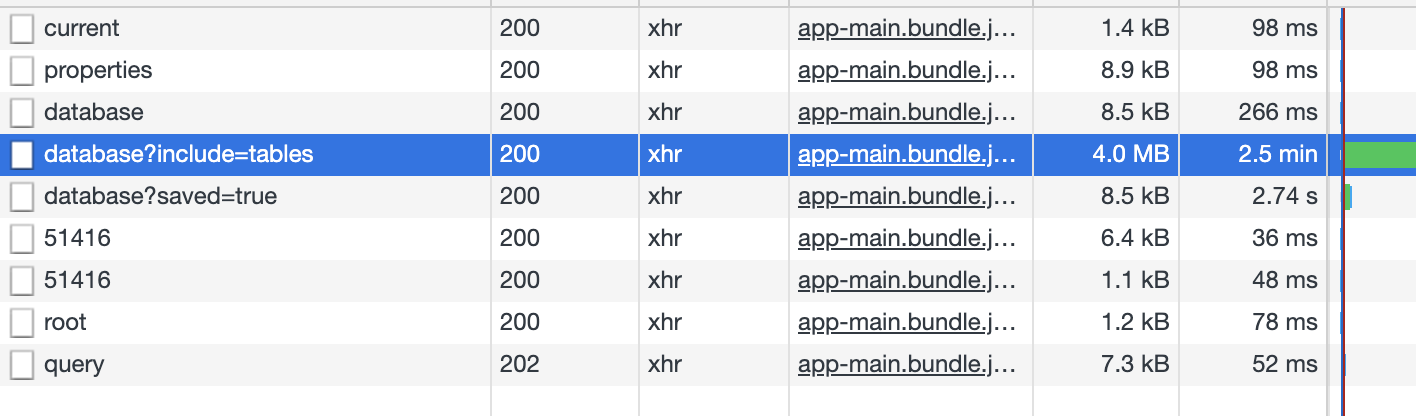
We have a datasource which contains thousands of tables. It took 2.5min to finish the API call. I believe this is one the of the reasons that our total active threads is always very high (hundreds to thousands). So my question is what are these information used for? Will it break something if we cache the endpoint? It seems dynamic filter needs this information.
Regards,
@canhduong Okay, if that’s the only thing slowing everything down, then that’s great, since it’s very specific and something we can reproduce internally.
There has been a lot of work to get Metabase to handle large installations - many of those fixes landed in 0.34 and 0.35:
https://github.com/metabase/metabase/issues/11856
But there’s still some outstanding parts:
https://github.com/metabase/metabase/issues/11806
https://github.com/metabase/metabase/issues/10035
If you cache that request, then every user will get the same result, but that might not match your permissions. You need to double check that you’re not exposing something.
But it’s definitely a workaround until we have a way to speedup this endpoint.
I made a hack in Metabase code to cache the endpoint, it shows good results for our Metabase instance so far, (CPU usage is significantly reduced).
1 Like