Good morning,
Is there any way to calculate the difference between two columns once we have a pivot table with aggregated data?
I mean to be able to have the difference between "REALITY-BUDGET".

Thank you very much.
Kind regards.
Good morning,
Is there any way to calculate the difference between two columns once we have a pivot table with aggregated data?
I mean to be able to have the difference between "REALITY-BUDGET".
Thank you very much.
Kind regards.
Hi @miquelmartorell
The calculation would need to be done on the data before the pivot.
Hi @flamber,
thnak for your reply.
Where? In the database Snowflake or in Metabase? How can i do?
My variables are so much, i have to calculate the difference by every grouped variables?
@miquelmartorell Since it sounds like you are aggregating the data in Metabase, then you would do it there with a Custom Column or Custom Expression:
https://www.metabase.com/learn/building-analytics/notebook-editor/custom-expressions.html
Thank you @flamber but i have only one column with amount and another column named origin that divides the rows by reality or budget... How can i do this by personalized expression in metabase?
Thank you
@miquelmartorell I don't think I completely understand what you're trying to do. If you are trying to do Excel-level calculations, then that is not possible. You would have to make such calculations in SQL.
Hi @flamber
Why can't this be an area of improvement like Qlikview does with its expressions for example?
I'm not asking for anything fancy, it's just calculating the difference between the actual value and the budget value in a pivot table like Excel has done all my life...
Thank you
@miquelmartorell You're welcome to open a feature request with a clear description of what you're looking for: https://github.com/metabase/metabase/issues/new/choose
Thank you @flamber, i will open a feature request in Github. I wish it could be done, in my company everybody is used to work with pivot tables and ratios on the results of these pivot tables.
@miquelmartorell I still don't understand completely what you're trying to do, so hopefully you'll explain that in the issue you create. It would probably be a really good idea to add screenshots to better explain it.
Good morning @flamber ,
yes, I am replicating an example with fictitious data, since I can't put the real data of the company, so in a while I hope to have it ready, you will see the aggregated data that I have already calculated in a SQL table of Snowflake and see how from that aggregated data calculate a few metrics.
@miquelmartorell But that's why I don't understand why you cannot make the aggregation before trying to pivot, just like you're doing in SQL.
You can use Sample Dataset, which is included in Metabase (can be activated via Admin > Databases). It's a little, simple H2 database with a few thousand columns.
Hi @flamber
I don't think the example database is suitable for this case.
I am working with two initial tables, actual data and budgeted data.
Each of these tables has the same columns/variables:
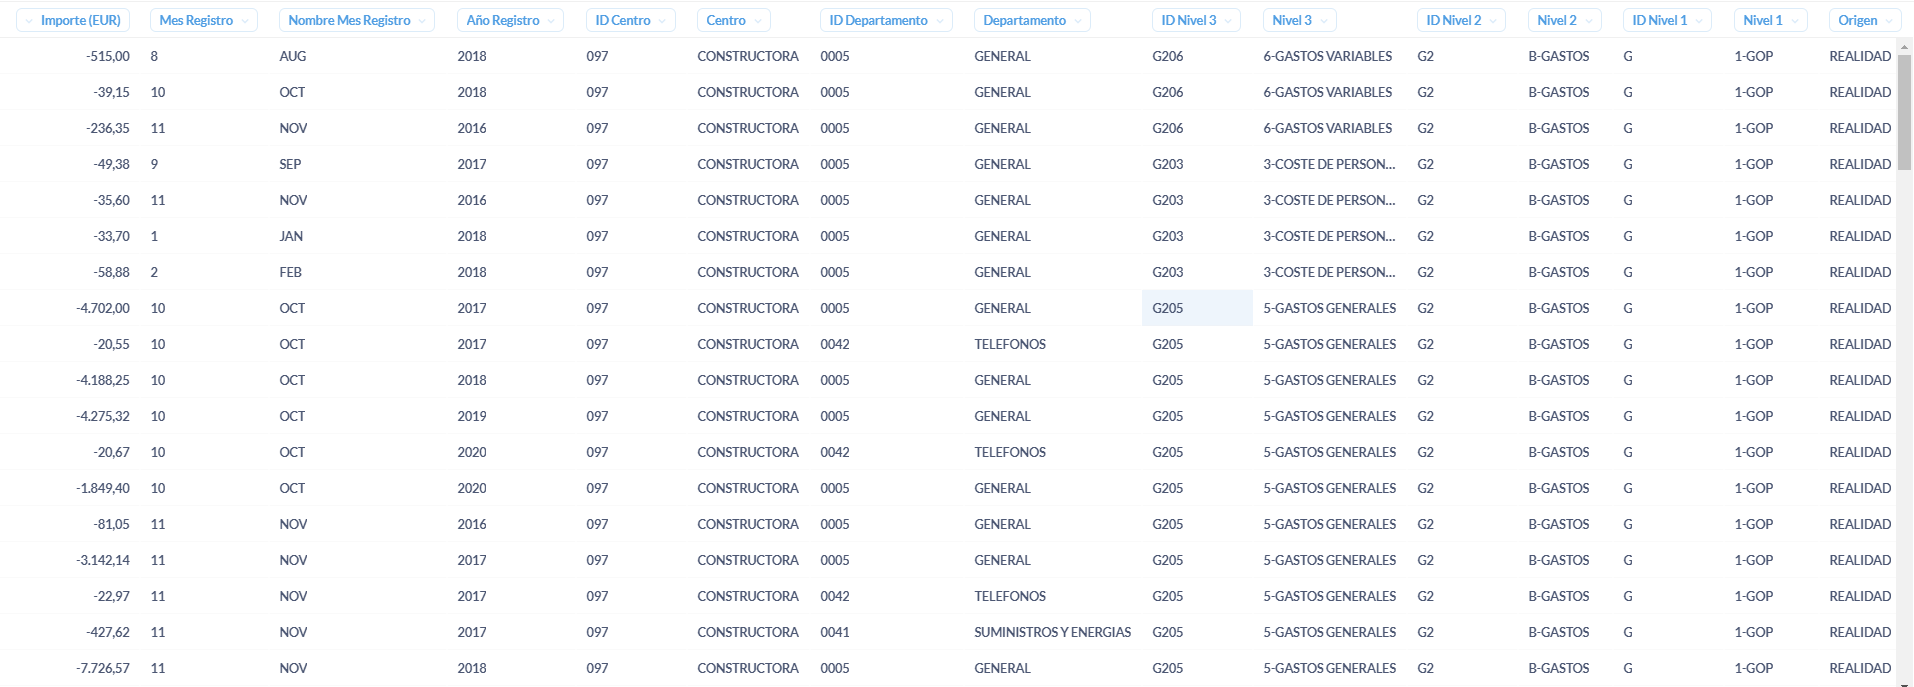
amount, date, company code, company code, plant, department, income statement level 1, income statement level 2, income statement level 3, among many other columns.
Before working with this raw data, I create a table with the aggregated data with the following variables only:
amount, year, month, company, company code, plant, department, income statement level 1, income statement level 2, income statement level 3, origin.
The variable "origin" contains two unique values: actual or budget, to know if this aggregated record is actual or budgeted.
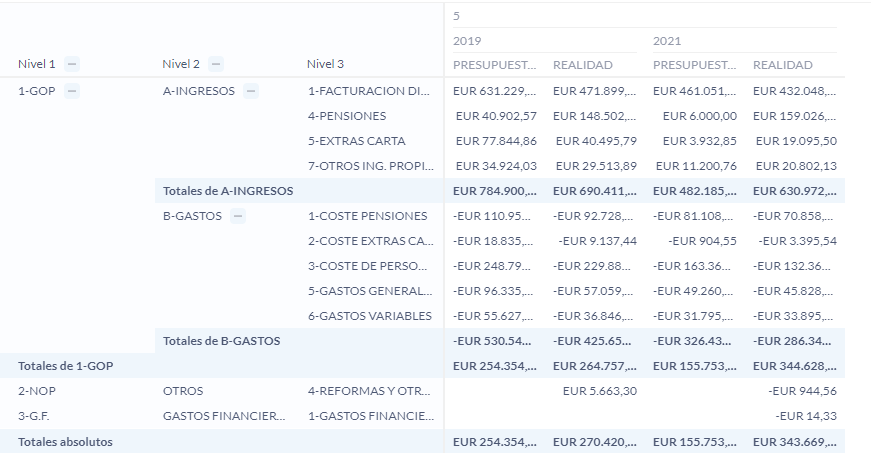
So, what I want to do is to display a dynamic table in which:
the rows are the income statement levels,
the columns should be the months, the years and the origin, so that I can see what the budget is for each month of each year versus the reality.
Here I am getting the actual and budgeted values for the month of May for the years 2019 and 2021, with their different levels of the income statement.
But I also want to get the difference from reality to budget for every year, 2019 and 2021, with a new two columns.
Thank you @flamber
@miquelmartorell Okay, so can you explain why a Custom Column or Custom Expression would not work? You just want the difference between two columns in the raw data.
Otherwise I'm afraid I don't understand the problem and you should just open an issue.
But the separate unaggregated raw data are not sorted, nor do they have to match all possible combinations of month, year, company, plant, department and income statement levels.
Is there any way to get a custom column from the amount column in the aggregated data, differentiating when it is actual and when it is budgeted?
Thank you @flamber
@miquelmartorell Please read the article about Custom Expressions. Yes, would be my answer, but it seems like I'm not able to understand exactly what you're trying to do, so I don't think I can help anymore.
Sorry if I've got the wrong end of the stick here. I think the confusion is around the structure of the data. The Budget and Actual values are on 2 different rows for each account and month. They want to calculate the variance between them.
Metabase expressions are effective for data items on the same row of data.
@miquelmartorell My 2 cents would be that you're better off getting them on the same row before you get into Metabase summaries or expressions, possibly before you get the data into Metabase at all, or in a Native SQL query. Join the Budget and Actual tables, use the Origin column to populated a Budget column and and Actual column respectively on the same row. From that point you can do the variance in a Metabase custom expression which is available for use in pivot tables.
Personally having the data on a single row makes all reporting simpler, I find that's what I spend half my time doing in order to make all further reporting on that data set simpler.
Again, sorry if I'm off on the wrong tangent here.
thank you both very much, it worked by placing in single row actual value and budgeted value for each month, year, plant, department and income statement levels.
May I add some complication to the problem and see how to best solve it?
notrom's suggestion of putting "Budget" and "Actual" on the same row in the database before loading to Metabase works well if there is only "Budget" and "Actual".
However, what if there are more than 2 states?
for example, after summarizing, I get the following table.
Date amount
202101 10
202102 15
202103 18
202104 10
202105 20
I want to see the difference between months. The result I want to see is as follows.
Date amount amount_diff
202101 10
202102 15 5
202103 18 3
202104 10 -8
202105 20 10
Is there a way to make such a table in Metabase?
any kind of date diff calculation in Metabase is not supported (yet) https://github.com/metabase/metabase/issues/16870
So I would suggest that you use a SQL question that you can then invoke from a GUI question to build your pivot table