Hi!
I apologize in advance if this question has already been answered, however I could not find any information about it, so I am asking my question here ( 0.49.7 version):
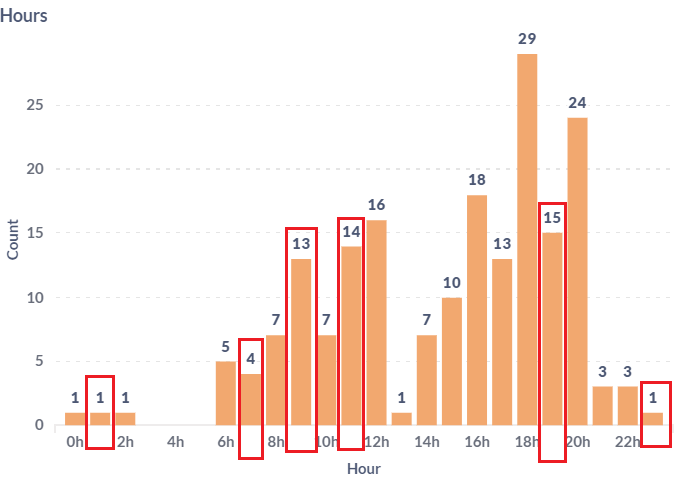
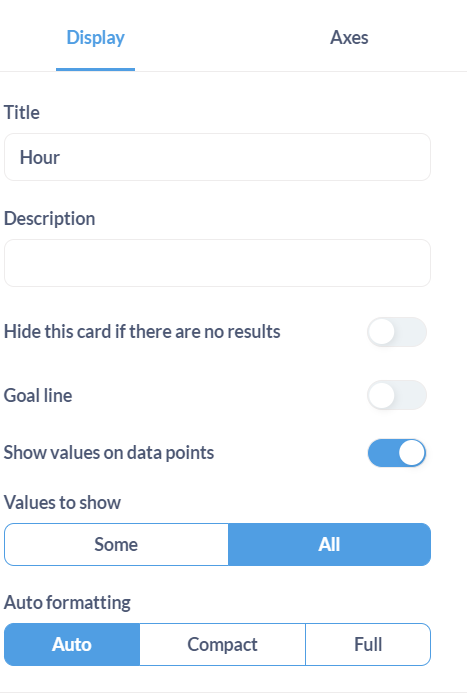
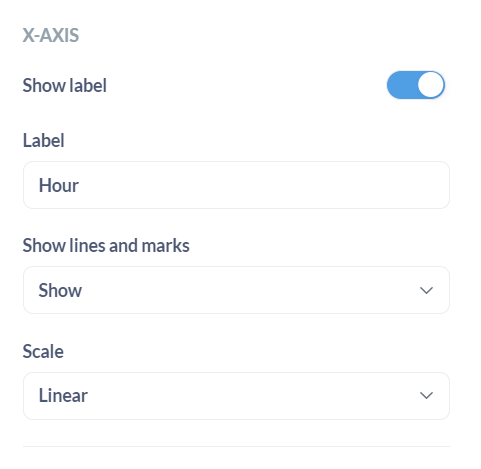
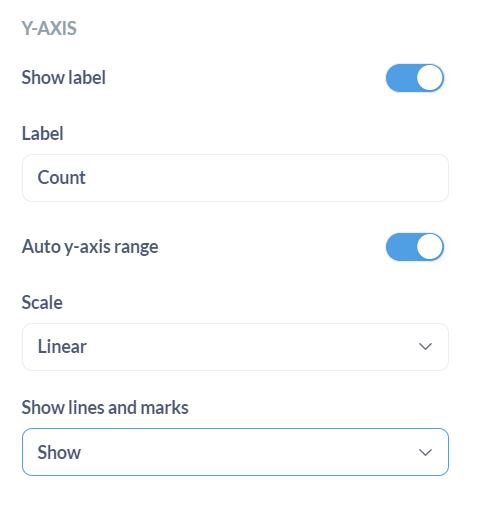
When creating a bar chart, not all the values appear on the y-axis, even when I try to change the graphical representation. Does anyone know how to make all the results appear?
I have attached an illustrative example.
Thank you very much in advance.