Displaying Bar Charts based on the Number of Bar produced

Hello,

Does anybody know how to display bar charts according to the number of bars you want to see?

For instance, using the sample dataset, I would like to view the top 3 categories based on the highest total ratings. Currently my code is:

select category, sum(rating) as "Total rating"
from PRODUCTS
group by category, vendor
order by sum(rating) desc
limit 3

However, it only shows this results which is not what I want.

What I would like to display are the 3 bars of categories: Gizmo, Gadget, and Widget

Does anybody know how I can do this?

Hi @hyo
Then don’t group by vendor if you are not using it
group by category

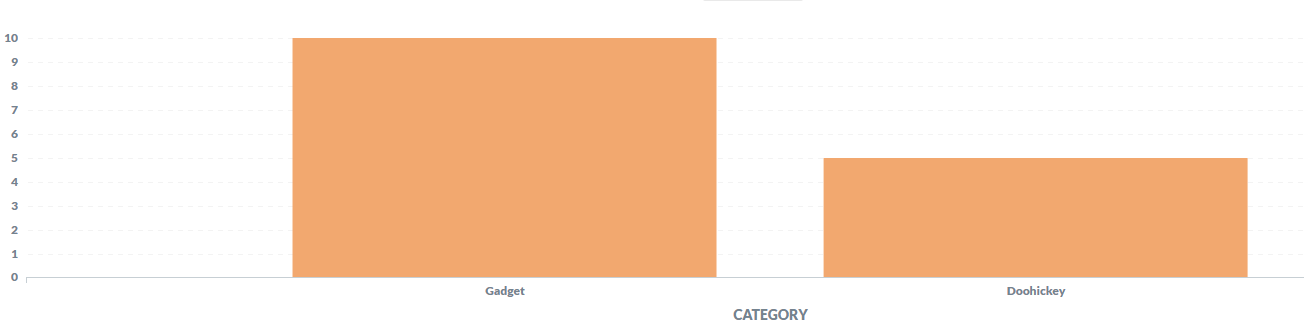
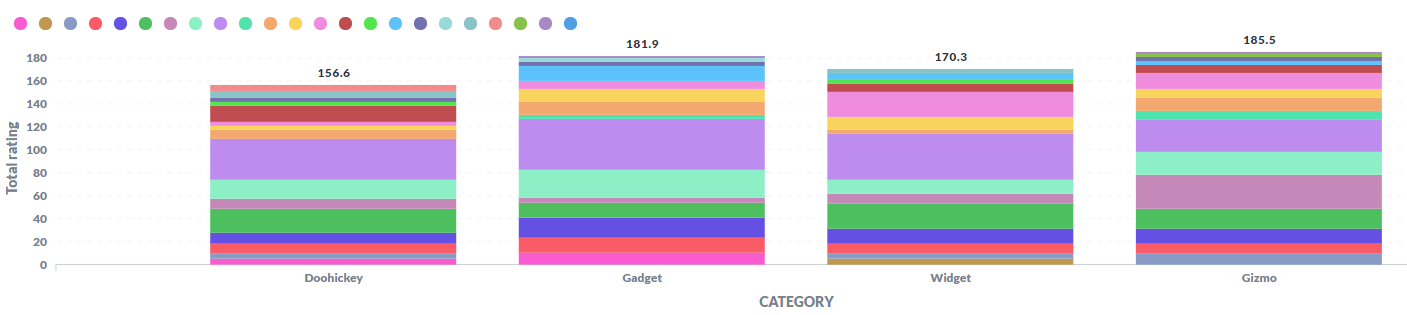
Hi @flamber, I am trying to group by category but I would also like to see the vendors that contributed to the top 3 categories. Is there any way to do this?

@hyo You would have to do some CTE or sub-selects to calculate the sum of the categories and limit that
It’s not really specific to Metabase, but general SQL query, so I would recommend that you have a look on stackoverflow.com or a forum dedicated to the database you are querying.