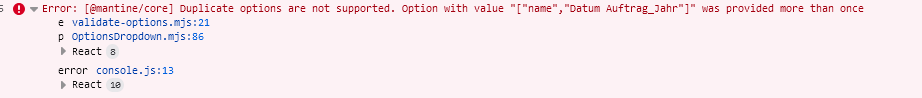
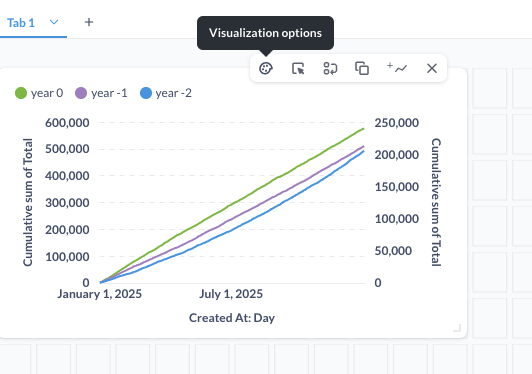
After updating to 54.4, after adding multiple series to display in a dashboard card, it generates an error in the browser console when clicking on 'Visualization Options':
As this happens, there is no way to edit the display of the series, which is quite sad.
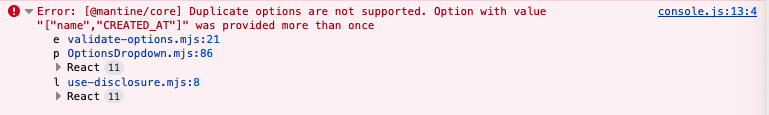
"{\"name\":\"Error\",\"message\":\"[@mantine/core] Duplicate options are not supported. Option with value \\\"[\\\"name\\\",\\\"Datum Auftrag_Jahr\\\"]\\\" was provided more than once\",\"stack\":\"Error: [@mantine/core] Duplicate options are not supported. Option with value \\\"[\\\"name\\\",\\\"Datum Auftrag_Jahr\\\"]\\\" was provided more than once\\n at e (
As this happens both in Firefox and Edge browser, it seems not to be browser related. Is there a way to circumvent that?
I wasn't able to reproduce this, could you try to reproduce this using the Sample Database and send the steps here? So we can report it or find a workaround.
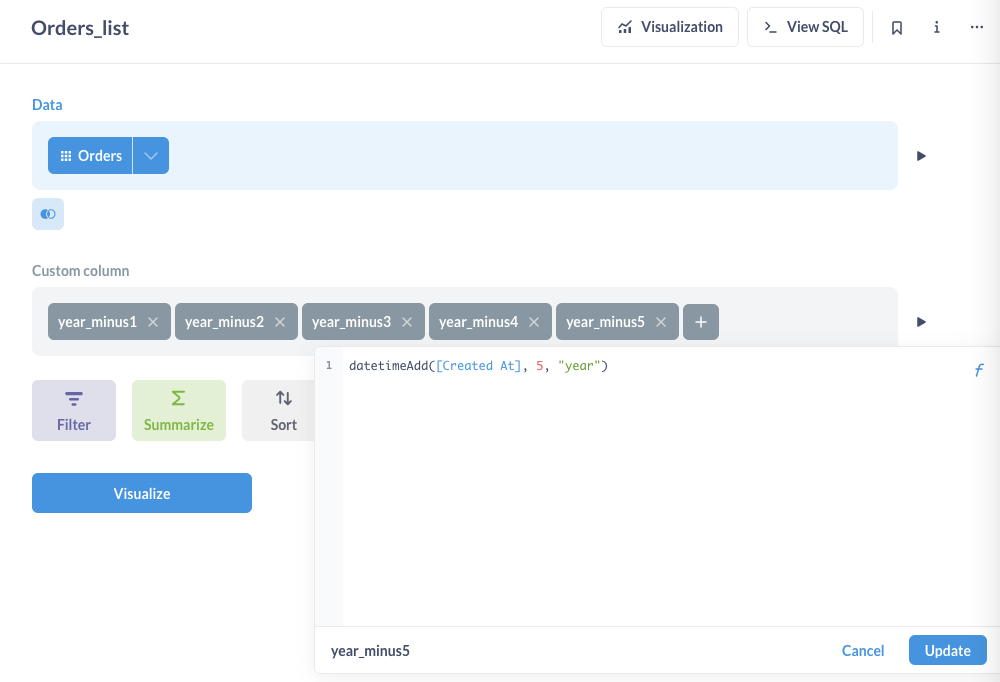
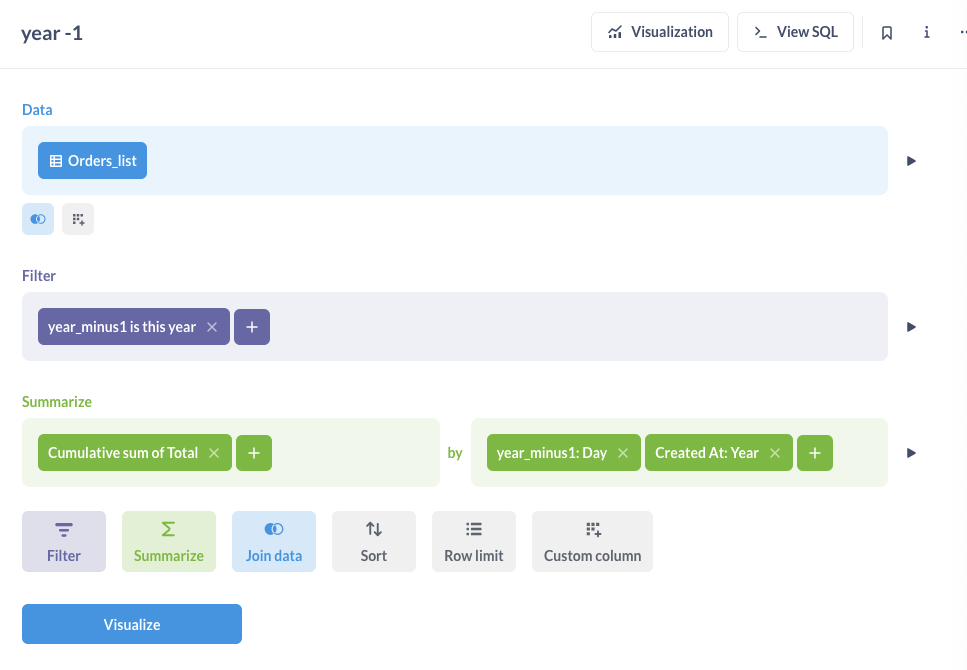
The error is caused because the second group by "Created at" is repeated in both questions and it is removed from the X axis of the line graphs.
As a workaround, we could avoid the group by "created at" as it does not add value here. The question seems to be a time series comparison, so please check out the docs on another approach on achieving this without the need to add series together in a Dashboard.
Many thanks for reporting that!
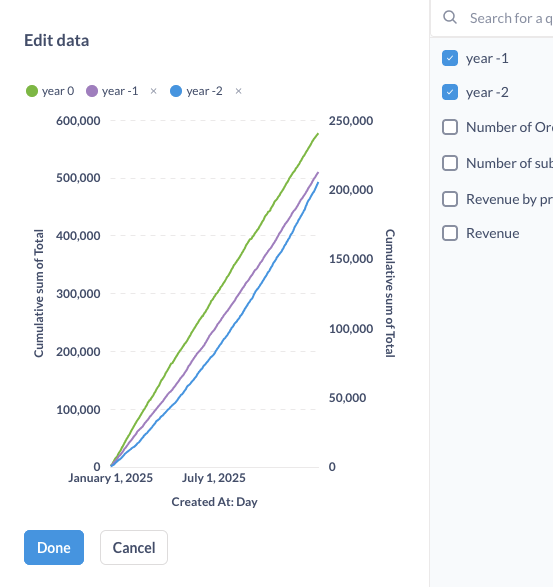
Yes, indeed the Problem could be circumvented for the time being by removing the original 'created at' field, but then when the users not having edit access click on it, it's a bit less easy to see the actual year as the whole thing is made using relative dates. But using relative dates in turn is much appreciated for this graphic.
I posted it as a bug because it posed no problem in the earlier version, which was metabase 0.53.something and appeared after the upgrade....
(On the other hand, one could also do breakouts by the whole year, but then the breakouts are named according to the year automatically, and this will change over time - but the name stays static. That's why in the end we turned towards this composing of the graphic )
and to no avail. issue continues to persist even after channel was removed. i’m hoping that we could re-visit this to see if there is a work around for it. we tried subscribing through emails and that seems to work just fine. hopefully something the team could help with, let us know if we can offer more details on this if there’s anything in particular that could help @marcos