Hi,
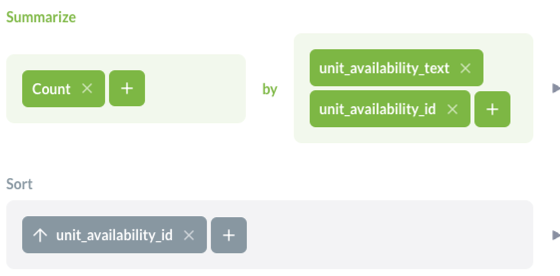
I've found multiple similar issues, but no fix has worked for me yet. I have a couple of static embed dashboards, all working fine. However, when I test sending these dashboards in emails, there is always an issue with displaying some of the charts.
Here is an example:
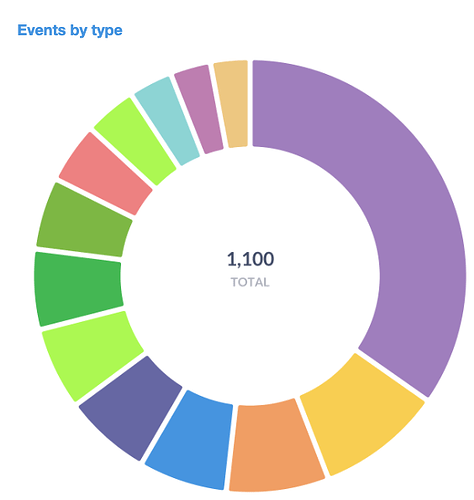
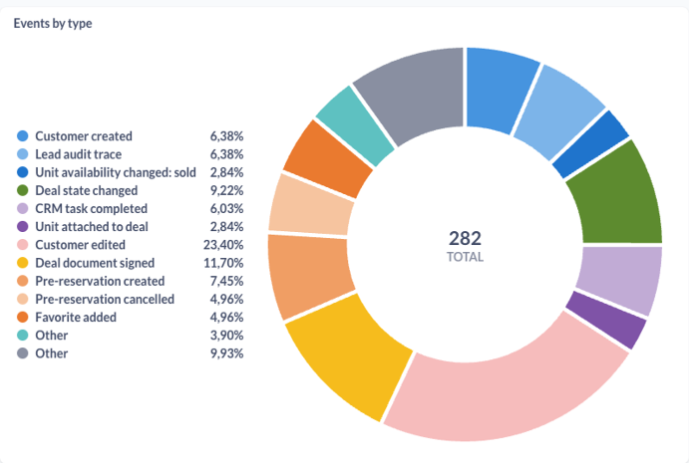
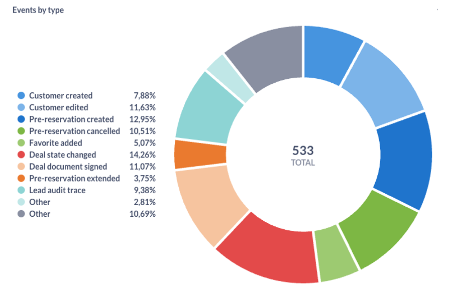
What I expect to receive (chart from dashboard)
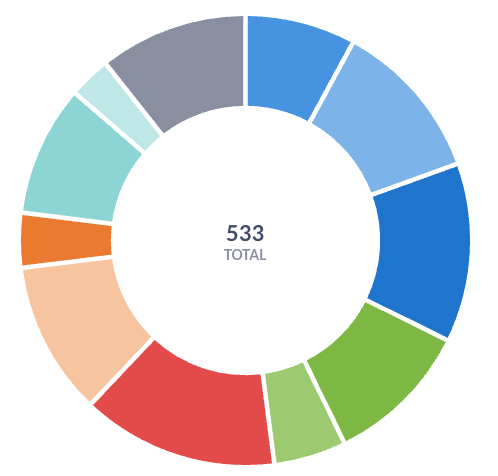
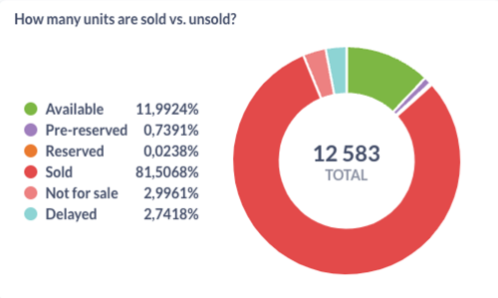
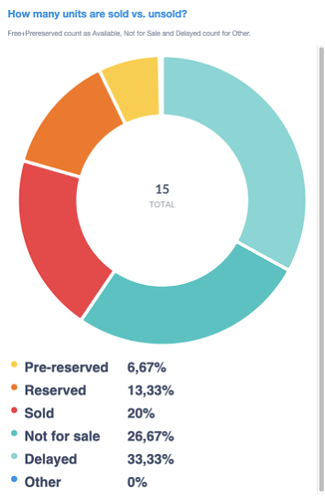
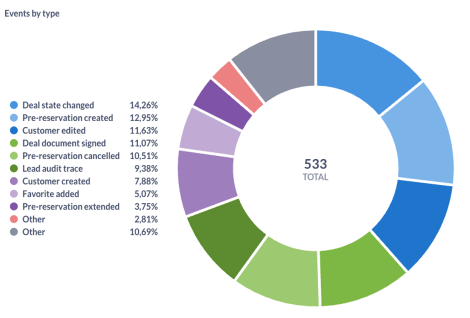
What I receive in email:

What do the logs say:
[7cf282d2-0602-421e-9573-11c11f660c8e] 2024-08-19T09:18:48+02:00 DEBUG metabase.server.middleware.log GET /api/dashboard/95 200 40.9 ms (10 DB calls) App DB connections: 1/15 Jetty threads: 5/50 (13 idle, 0 queued) (115 total active threads) Queries in flight: 0 (0 queued) {:metabase-user-id 48}
[7cf282d2-0602-421e-9573-11c11f660c8e] 2024-08-19T09:18:48+02:00 DEBUG metabase.server.middleware.log GET /api/dashboard/95/query_metadata 200 91.7 ms (48 DB calls) App DB connections: 0/15 Jetty threads: 4/50 (13 idle, 0 queued) (117 total active threads) Queries in flight: 0 (0 queued) {:metabase-user-id 48}
[7cf282d2-0602-421e-9573-11c11f660c8e] 2024-08-19T09:18:48+02:00 DEBUG metabase.server.middleware.log GET /api/pulse/form_input 200 232.7 µs (0 DB calls) App DB connections: 0/15 Jetty threads: 7/50 (10 idle, 0 queued) (117 total active threads) Queries in flight: 0 (0 queued) {:metabase-user-id 48}
[7cf282d2-0602-421e-9573-11c11f660c8e] 2024-08-19T09:18:49+02:00 DEBUG metabase.server.middleware.log GET /api/pulse/form_input 200 344.2 µs (0 DB calls) App DB connections: 0/15 Jetty threads: 4/50 (12 idle, 0 queued) (120 total active threads) Queries in flight: 3 (0 queued) {:metabase-user-id 48}
[7cf282d2-0602-421e-9573-11c11f660c8e] 2024-08-19T09:18:49+02:00 DEBUG metabase.server.middleware.log GET /api/user/recipients 200 4.0 ms (2 DB calls) App DB connections: 1/15 Jetty threads: 5/50 (12 idle, 0 queued) (120 total active threads) Queries in flight: 3 (0 queued) {:metabase-user-id 48}
[7cf282d2-0602-421e-9573-11c11f660c8e] 2024-08-19T09:18:49+02:00 DEBUG metabase.server.middleware.log GET /api/pulse 200 7.0 ms (5 DB calls) App DB connections: 0/15 Jetty threads: 4/50 (12 idle, 0 queued) (120 total active threads) Queries in flight: 3 (0 queued) {:metabase-user-id 48}
[7cf282d2-0602-421e-9573-11c11f660c8e] 2024-08-19T09:18:50+02:00 DEBUG metabase.server.middleware.log POST /api/dashboard/95/dashcard/818/card/797/query 202 [ASYNC: completed] 1.6 s (25 DB calls) App DB connections: 1/15 Jetty threads: 3/50 (12 idle, 0 queued) (120 total active threads) Queries in flight: 3 (0 queued); postgres DB 3 connections: 0/3 (0 threads blocked) {:metabase-user-id 48}
[7cf282d2-0602-421e-9573-11c11f660c8e] 2024-08-19T09:18:50+02:00 DEBUG metabase.server.middleware.log POST /api/dashboard/95/dashcard/946/card/966/query 202 [ASYNC: completed] 1.6 s (24 DB calls) App DB connections: 2/15 Jetty threads: 3/50 (12 idle, 0 queued) (120 total active threads) Queries in flight: 1 (0 queued); postgres DB 3 connections: 1/3 (0 threads blocked) {:metabase-user-id 48}
[7cf282d2-0602-421e-9573-11c11f660c8e] 2024-08-19T09:18:51+02:00 DEBUG metabase.server.middleware.log POST /api/dashboard/pivot/95/dashcard/800/card/794/query 202 [ASYNC: completed] 3.1 s (39 DB calls) App DB connections: 1/15 Jetty threads: 3/50 (12 idle, 0 queued) (120 total active threads) Queries in flight: 0 (0 queued); postgres DB 3 connections: 0/3 (0 threads blocked) {:metabase-user-id 48}
[7cf282d2-0602-421e-9573-11c11f660c8e] 2024-08-19T09:18:58+02:00 ERROR metabase.pulse.render Pulse card render error,java.lang.ClassCastException
[7cf282d2-0602-421e-9573-11c11f660c8e] 2024-08-19T09:18:58+02:00 INFO metabase.public-settings.premium-features Checking with the MetaStore to see whether token '8ac2...3710' is valid...
[7cf282d2-0602-421e-9573-11c11f660c8e] 2024-08-19T09:18:59+02:00 DEBUG metabase.server.middleware.log GET /api/setting 200 367.4 ms (28 DB calls) App DB connections: 1/15 Jetty threads: 6/50 (11 idle, 0 queued) (120 total active threads) Queries in flight: 0 (0 queued) {:metabase-user-id 48}
[7cf282d2-0602-421e-9573-11c11f660c8e] 2024-08-19T09:18:59+02:00 DEBUG metabase.server.middleware.log GET /api/session/properties 200 366.2 ms (12 DB calls) App DB connections: 0/15 Jetty threads: 6/50 (11 idle, 0 queued) (120 total active threads) Queries in flight: 0 (0 queued) {:metabase-user-id 48}
[7cf282d2-0602-421e-9573-11c11f660c8e] 2024-08-19T09:18:59+02:00 DEBUG metabase.server.middleware.log GET /api/session/properties 200 14.1 ms (12 DB calls) App DB connections: 0/15 Jetty threads: 6/50 (11 idle, 0 queued) (122 total active threads) Queries in flight: 0 (0 queued) {:metabase-user-id 48}
[7cf282d2-0602-421e-9573-11c11f660c8e] 2024-08-19T09:18:59+02:00 DEBUG metabase.server.middleware.log GET /api/setting 200 24.7 ms (27 DB calls) App DB connections: 0/15 Jetty threads: 6/50 (11 idle, 0 queued) (122 total active threads) Queries in flight: 0 (0 queued) {:metabase-user-id 48}
[7cf282d2-0602-421e-9573-11c11f660c8e] 2024-08-19T09:18:59+02:00 DEBUG metabase.server.middleware.log POST /api/pulse/test 200 4.3 s (141 DB calls) App DB connections: 0/15 Jetty threads: 4/50 (11 idle, 0 queued) (122 total active threads) Queries in flight: 0 (0 queued); postgres DB 3 connections: 0/3 (0 threads blocked) {:metabase-user-id 48}
[7cf282d2-0602-421e-9573-11c11f660c8e] 2024-08-19T09:18:59+02:00 DEBUG metabase.server.middleware.log GET /api/setup/admin_checklist 200 11.2 ms (11 DB calls) App DB connections: 0/15 Jetty threads: 5/50 (12 idle, 0 queued) (122 total active threads) Queries in flight: 0 (0 queued) {:metabase-user-id 48}
[7cf282d2-0602-421e-9573-11c11f660c8e] 2024-08-19T09:18:59+02:00 DEBUG metabase.server.middleware.log GET /api/util/bug_report_details 200 4.1 ms (1 DB calls) App DB connections: 0/15 Jetty threads: 4/50 (12 idle, 0 queued) (122 total active threads) Queries in flight: 0 (0 queued) {:metabase-user-id 48}
Any ideas? Such a weird behavior


