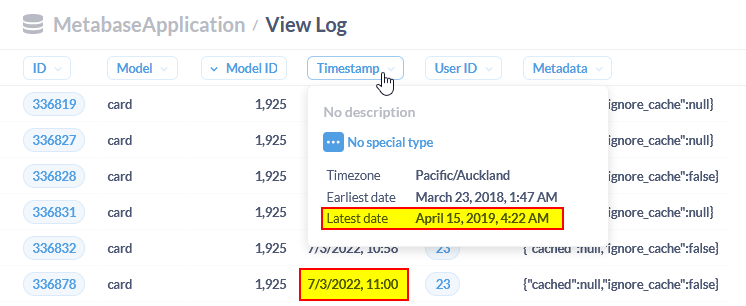
Table column header tooltips are a nice addition, they can give good context (is this a category, ID, FK etc.) about a field but I'm finding some of the data they present a little misleading. It looks like min, max, avgs for numbers and dates are coming from the Metabase application database, field Fingerprint value, the issue with this is this is doesn't seem to update as the data changes.
From the doco at Troubleshooting syncs, scans, and fingerprinting
Metabase only fingerprints each column once, unless the administrator explicitly tells it to fingerprint the column again, or in the rare event that a new release of Metabase changes the fingerprinting logic.
I'm sure that logic works great for the original intent of the fingerprints, but I don't think it's a good choice for displaying to end users as a field summary. I'm aware that fingerprints only cover the top 10,000 rows, this will also likely skew this towards early data.
For example here's what it's telling me about the Metabase View Log table, it's clearly contradicting itself:
I like the idea behind the tooltips, I just wish they represented my data correctly.
(EDITED TO ADD as discourse won't allow more than 3 consecutive replies ...)
@maz I know this is an older topic but hopefully you're still looking at it.
"Text or Category" and "Number" filters on dashboards are really useful, I've already made use of these multiple times.
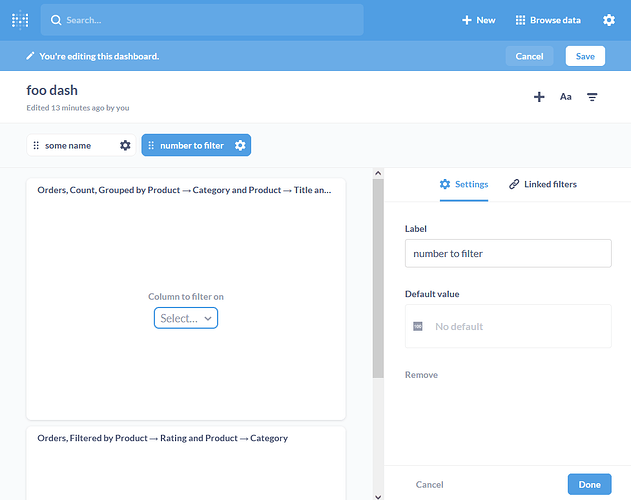
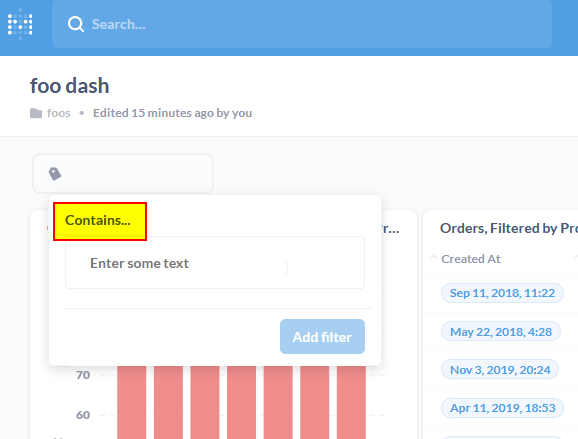
One gripe I have though is that once you've selected the sub-type from the "What kind of filter" menu (i.e. Dropdown, Is not, Contains etc.) when creating a new filter, there is no indicator on the filter settings sidebar showing that subtype. How do I know how the "number to filter" value below will be applied?
When you're using the dashboard and entering the a filter value the subtype of the filter is displayed, but that's not visible when editing

Now that I think about it, it's not a v0.42 specific thing. It would be handy to indicate the type and subtype of filters in the filter settings edit sidebar.
Keep up the good work!
