Hi,
I've a database with all the invoices I send, with fields like date, amount, ...
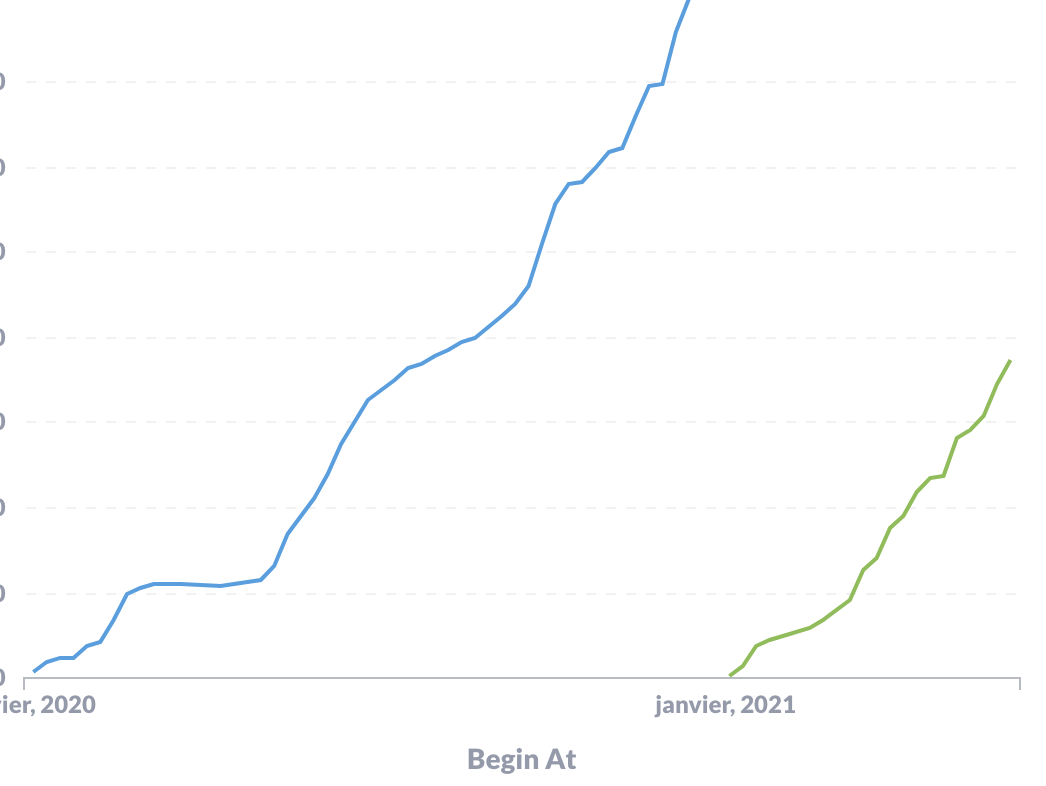
I'd like to generate a graph of my cumulative revenue per year. I mean :
- a serie per year
- all the series start at 0€ on the 01/01 then increase each time there is a invoice (can be group by week/month)
- X-axe can be the number of days/months since the beginning of the year
- Y-axe should be cumulative sum of the amount of the invoices i sent since the beginning of the year
I hope it's clear 
Do you know can I do that? Thank you very much!
Hi @camilleroux
Because of a limitation of how cumulative values currently works, you would have to create separate questions for each year and then combine them on a dashboard:
https://github.com/metabase/metabase/issues/2862 - upvote by clicking  on the first post
1 Like
Thanks!
I tried what you did but it's not perfect. Do you know how I can overlay this two series?
@camilleroux
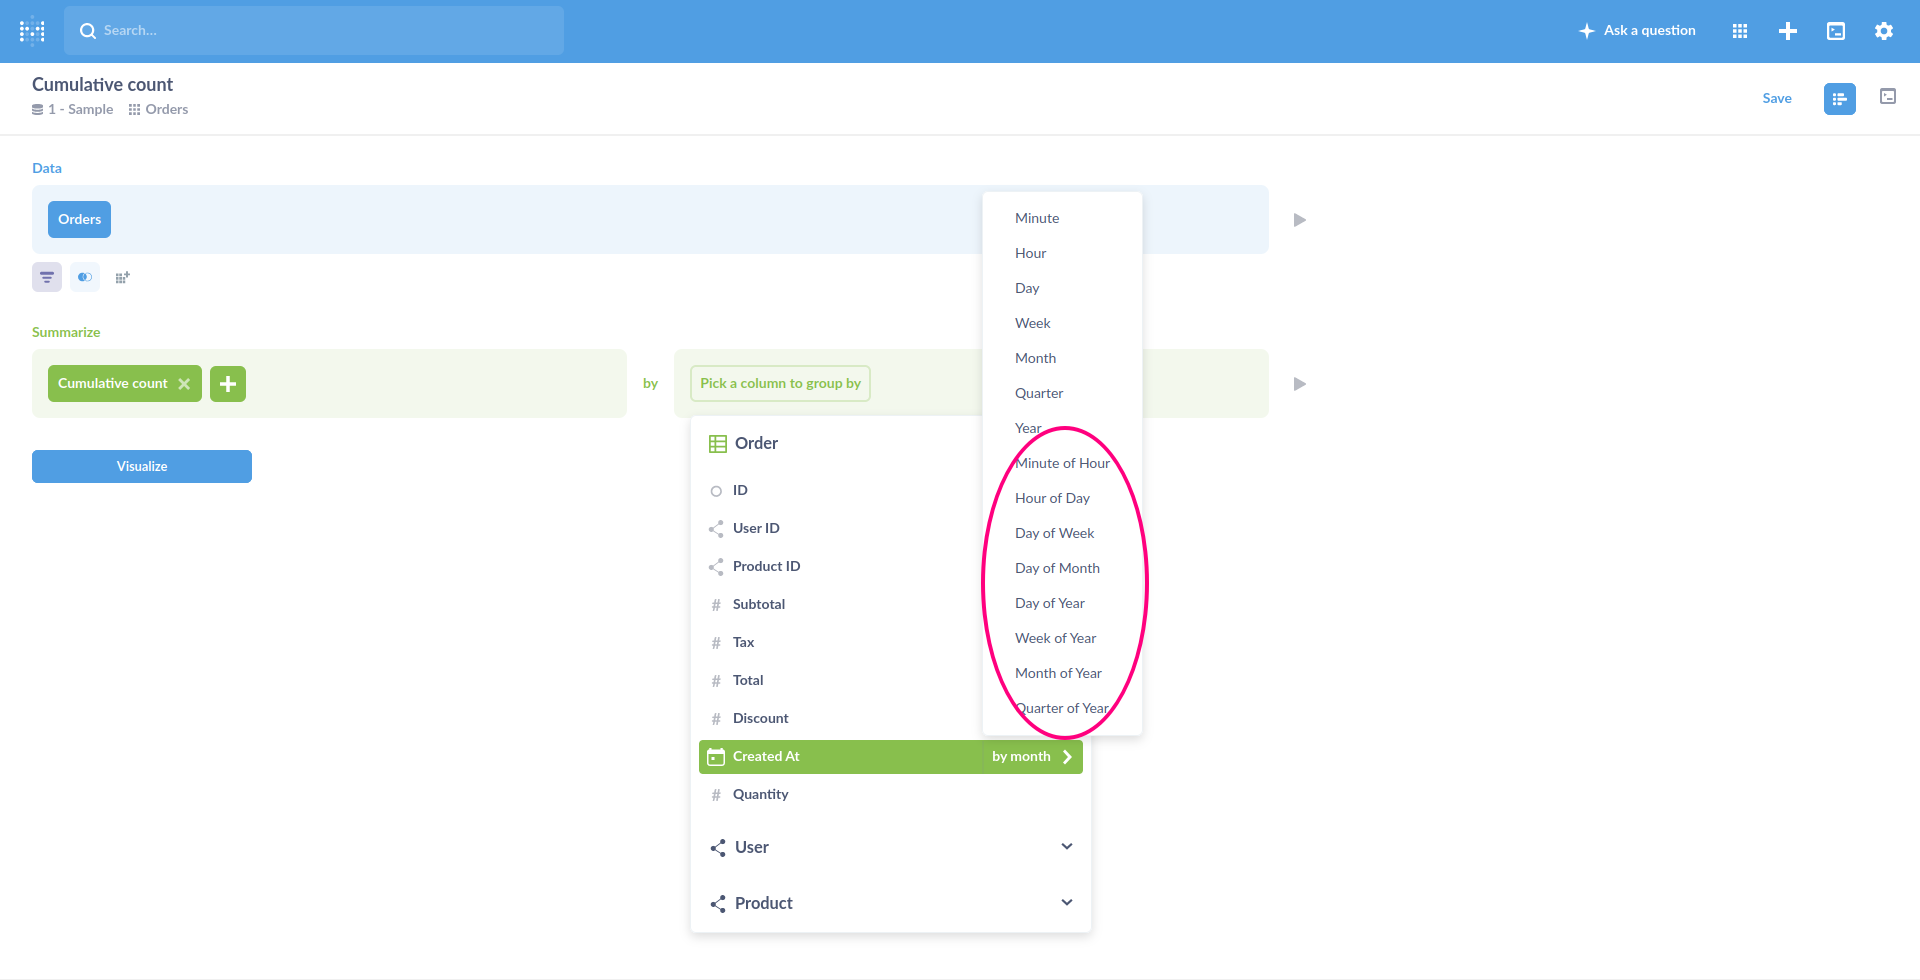
Yes, don't return full dates, but just relative like "Week of year", which just returns a week number.
1 Like
Can I do that with the editor? or do i have to write the request in SQL?