Hey. I have integrated Metabase with Athena. Everything seems to work well but when I plot the graph against my data, the bars are not aligning with the data.
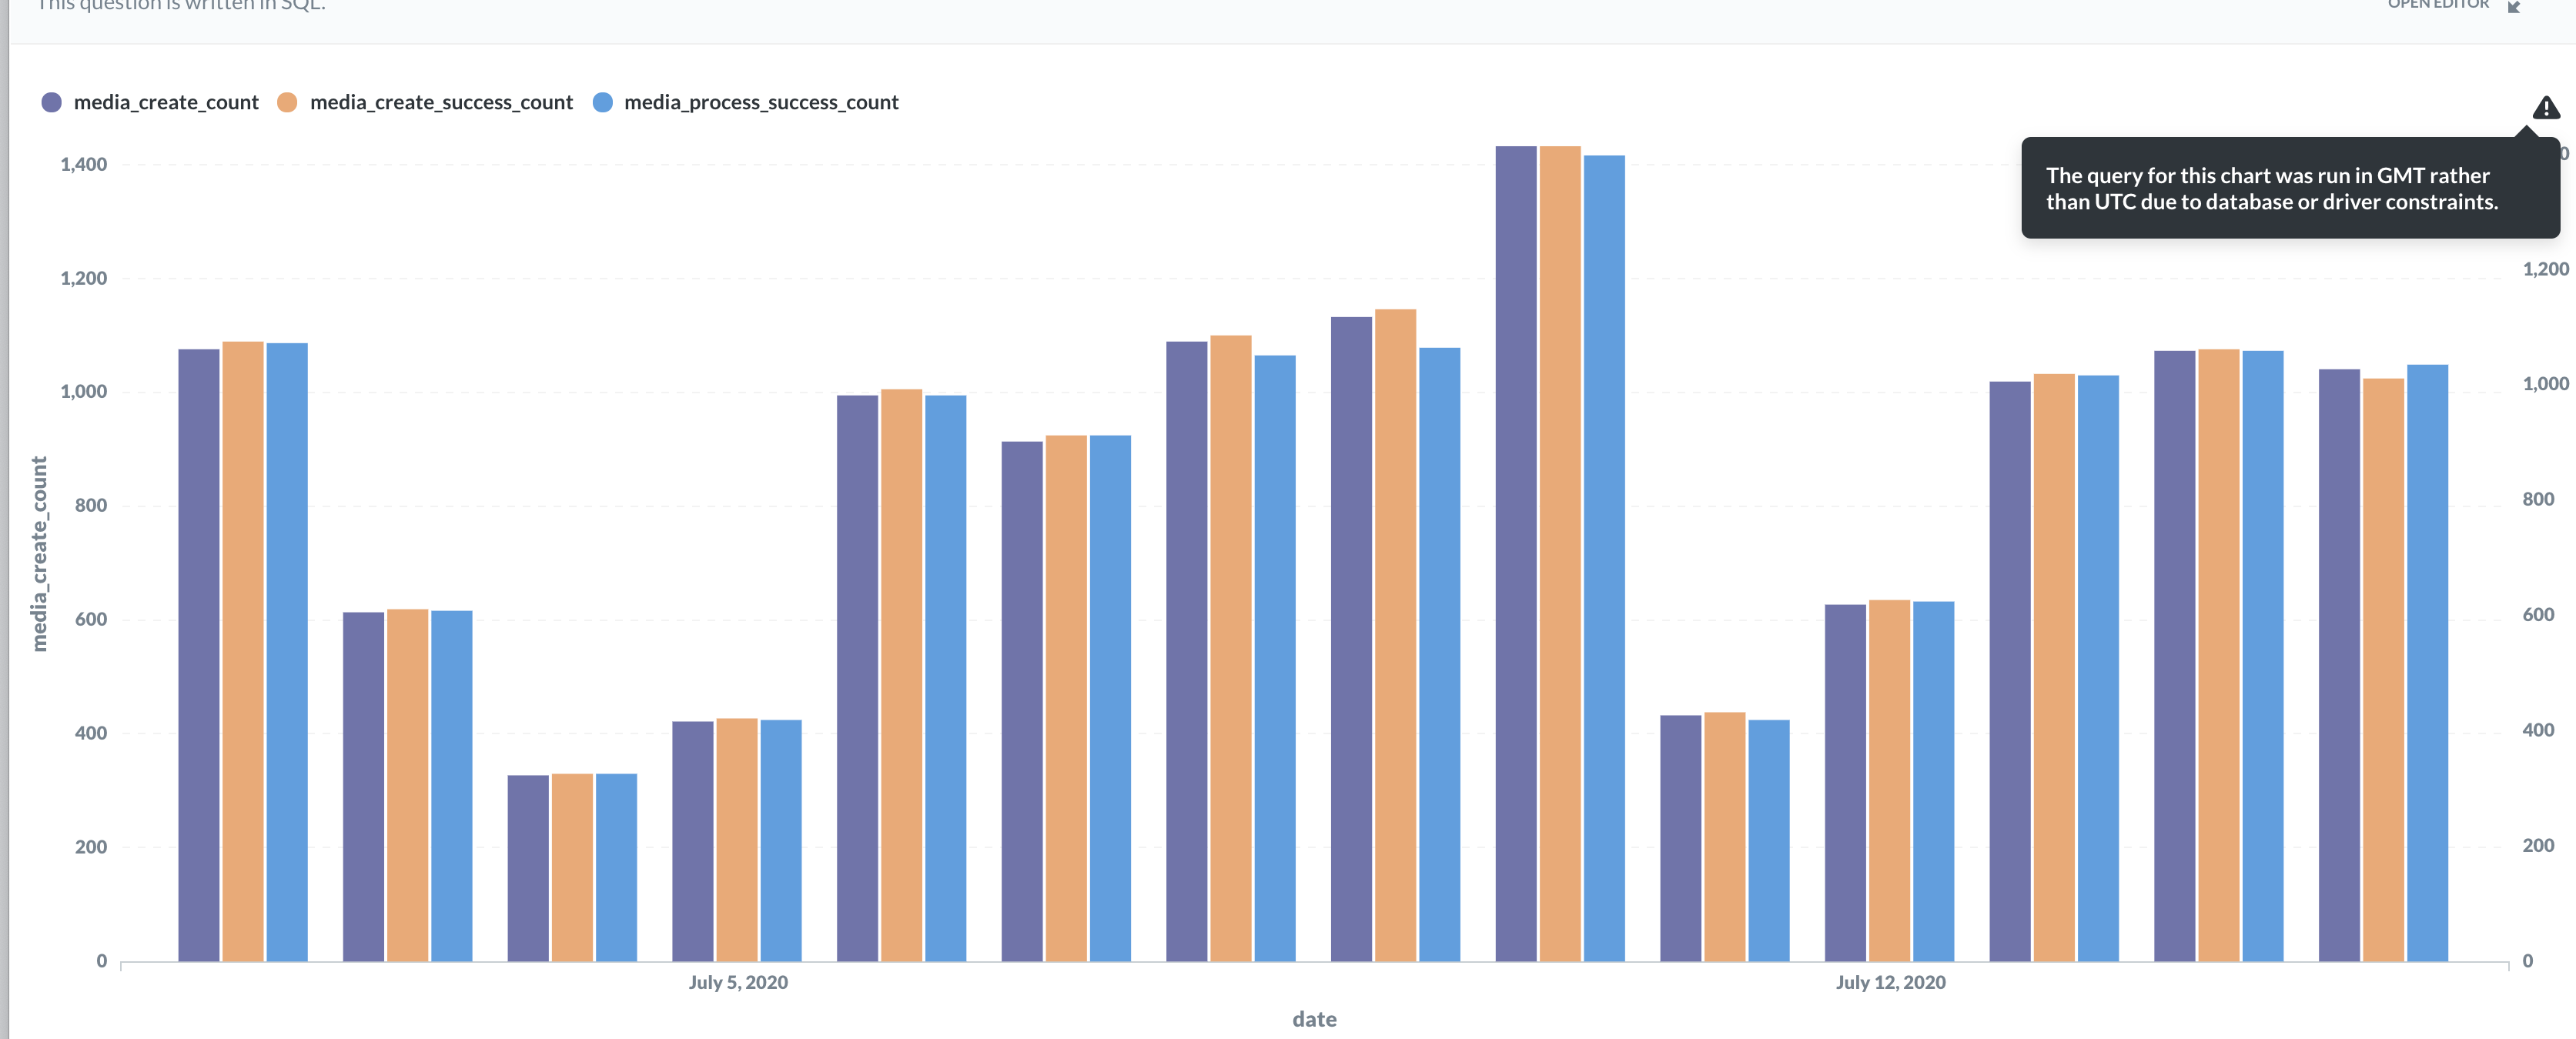
If you see in the below image media_create_count has the maximum value of 1075 but its bar value is shortest amongst the three. How can I fix this? Is there something that I am doing wrong?
Hi @shubham-mt
Please post “Diagnostic Info” from Admin > Troubleshooting.
Notice the black triangle in top-right corner - I’m guessing that it’s complaining about unaggregated values.
My guess is that you’re seeing this issue:
https://github.com/metabase/metabase/issues/11907 - upvote by clicking  on the first post
Hello @flamber. The Diagnostic Info says this
{
"browser-info": {
"language": "en-GB",
"platform": "MacIntel",
"userAgent": "Mozilla/5.0 (Macintosh; Intel Mac OS X 10_15_5) AppleWebKit/537.36 (KHTML, like Gecko) Chrome/83.0.4103.116 Safari/537.36",
"vendor": "Google Inc."
},
"system-info": {
"file.encoding": "UTF-8",
"java.runtime.name": "OpenJDK Runtime Environment",
"java.runtime.version": "11.0.7+10",
"java.vendor": "AdoptOpenJDK",
"java.vendor.url": "https://adoptopenjdk.net/",
"java.version": "11.0.7",
"java.vm.name": "OpenJDK 64-Bit Server VM",
"java.vm.version": "11.0.7+10",
"os.name": "Linux",
"os.version": "4.14.154-128.181.amzn2.x86_64",
"user.language": "en",
"user.timezone": "GMT"
},
"metabase-info": {
"databases": [
"mysql",
"athena"
],
"hosting-env": "unknown",
"application-database": "mysql",
"application-database-details": {
"database": {
"name": "MySQL",
"version": "8.0.19"
},
"jdbc-driver": {
"name": "MariaDB Connector/J",
"version": "2.5.1"
}
},
"run-mode": "prod",
"version": {
"date": "2020-05-28",
"tag": "v0.35.4",
"branch": "release-0.35.x",
"hash": "b3080fa"
},
"settings": {
"report-timezone": "UTC"
}
}
}
The black triangle gives this message.
@shubham-mt Can you post the exported table, since I cannot reproduce. I don’t know if the it is a problem specific to Athena, so try something similar with MySQL or the built-in H2 Sample Dataset.
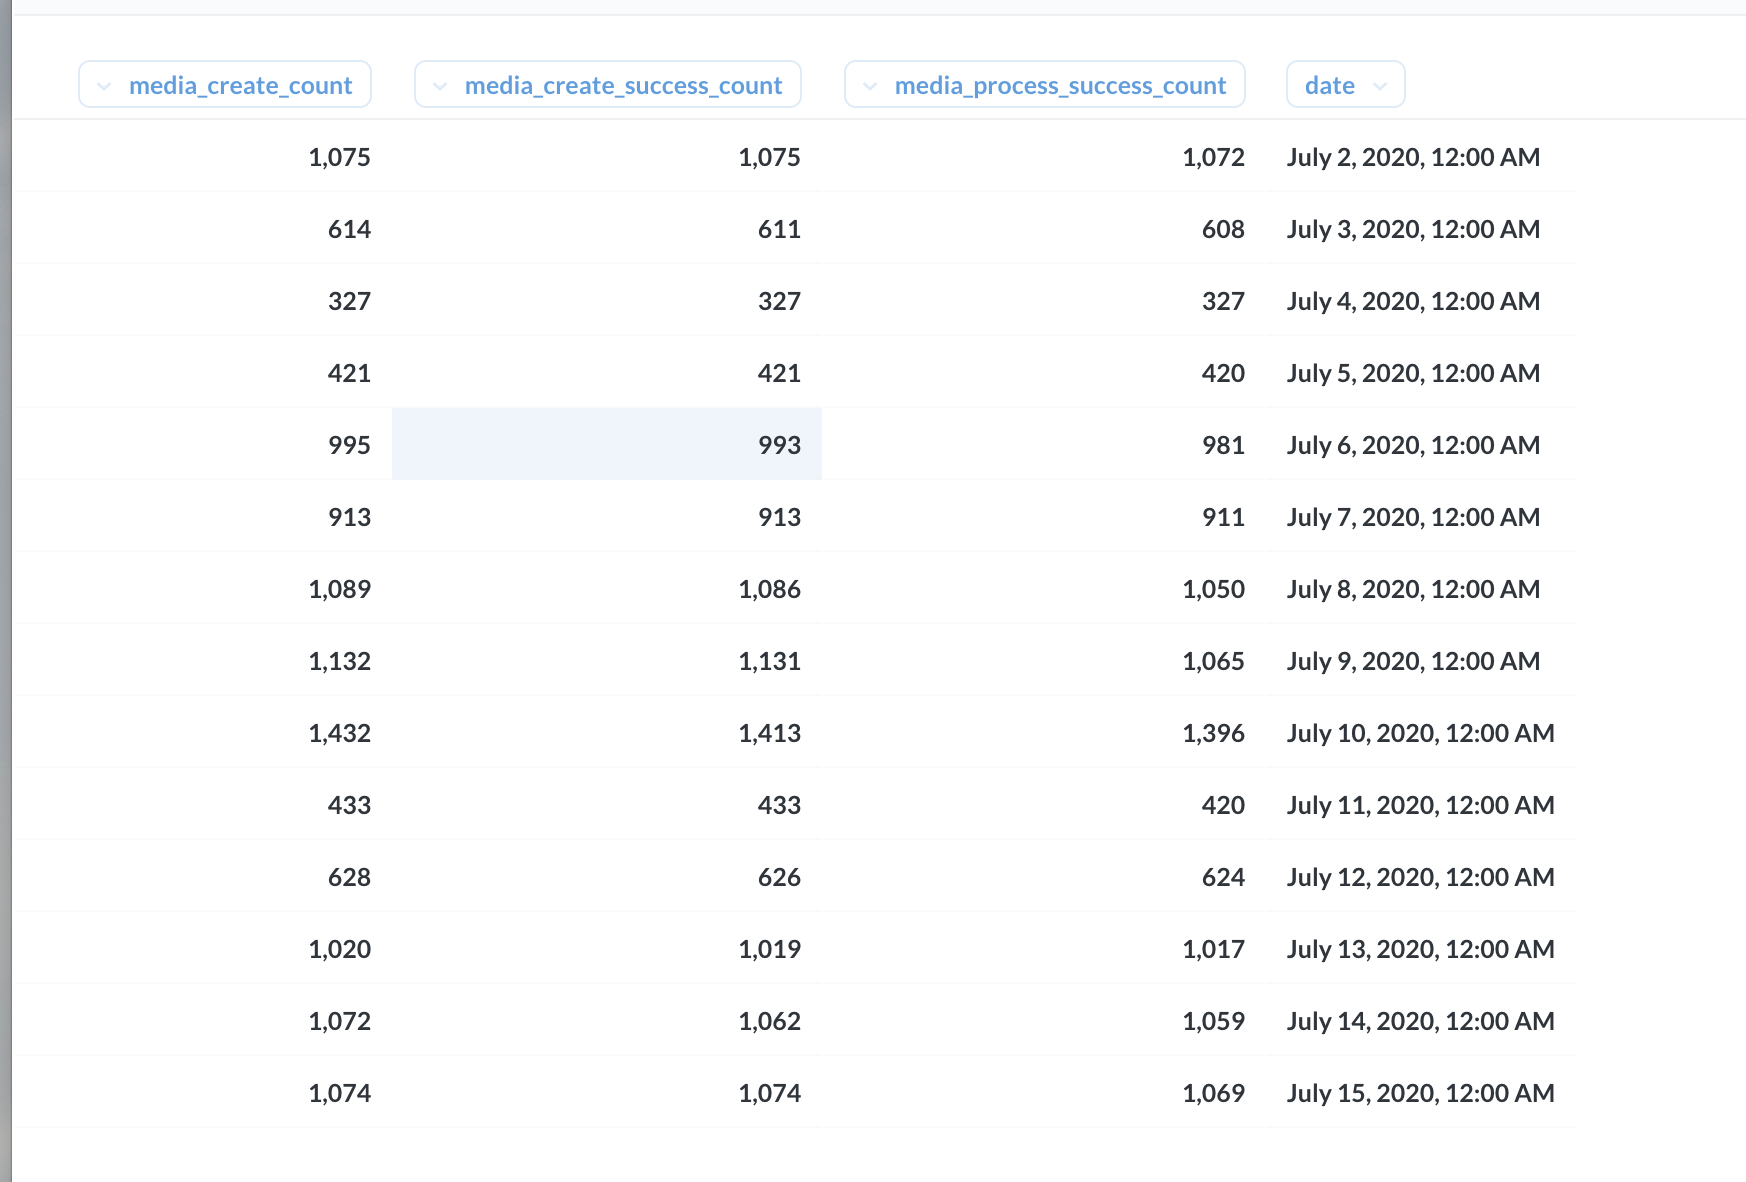
@flamber This is the table on which this graph is plotted
I don't own MySQL connection but I can try on H2 Sample Dataset. But however this seems problems related to Matabase graph plotting.
@shubham-mt Can you post that as text (or CSV file). I’m not going to try to reproduce by manually entering all the values from a screenshot.
You would be amazed what can mess up visualizations depending on the driver.
@flamber The problem is now solved. In the below screenshot I selected right. I don't exactly know how did it solve but my graphs are now consistent.
@shubham-mt Go the Axes and disable the “Use a split y-axis when necessary”.
I would call that a bug, since the results are very similar, so it shouldn’t split the axis in this case.
But please post the table in text, so I can create an issue for it.
@flamber There is no option to upload a csv/json here so pasting the entire data.
| media_create_count |
media_create_success_count |
media_process_success_count |
date |
| 1075 |
1075 |
1072 |
2020-07-02T00:00:00Z |
| 614 |
611 |
608 |
2020-07-03T00:00:00Z |
| 327 |
327 |
327 |
2020-07-04T00:00:00Z |
| 421 |
421 |
420 |
2020-07-05T00:00:00Z |
| 995 |
993 |
981 |
2020-07-06T00:00:00Z |
| 913 |
913 |
911 |
2020-07-07T00:00:00Z |
| 1089 |
1086 |
1050 |
2020-07-08T00:00:00Z |
| 1132 |
1131 |
1065 |
2020-07-09T00:00:00Z |
| 1432 |
1413 |
1396 |
2020-07-10T00:00:00Z |
| 433 |
433 |
420 |
2020-07-11T00:00:00Z |
| 628 |
626 |
624 |
2020-07-12T00:00:00Z |
| 1020 |
1019 |
1017 |
2020-07-13T00:00:00Z |
| 1072 |
1062 |
1059 |
2020-07-14T00:00:00Z |
| 1283 |
1283 |
1278 |
2020-07-15T00:00:00Z |
| 683 |
683 |
681 |
2020-07-16T00:00:00Z |
1 Like
@shubham-mt I’ve created an issue for this:
https://github.com/metabase/metabase/issues/12939 - upvote by clicking on the first post

 on the first post