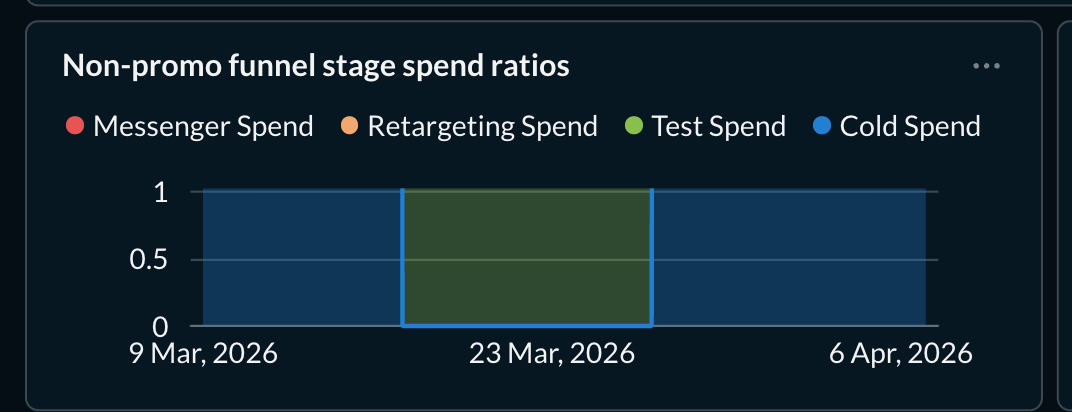
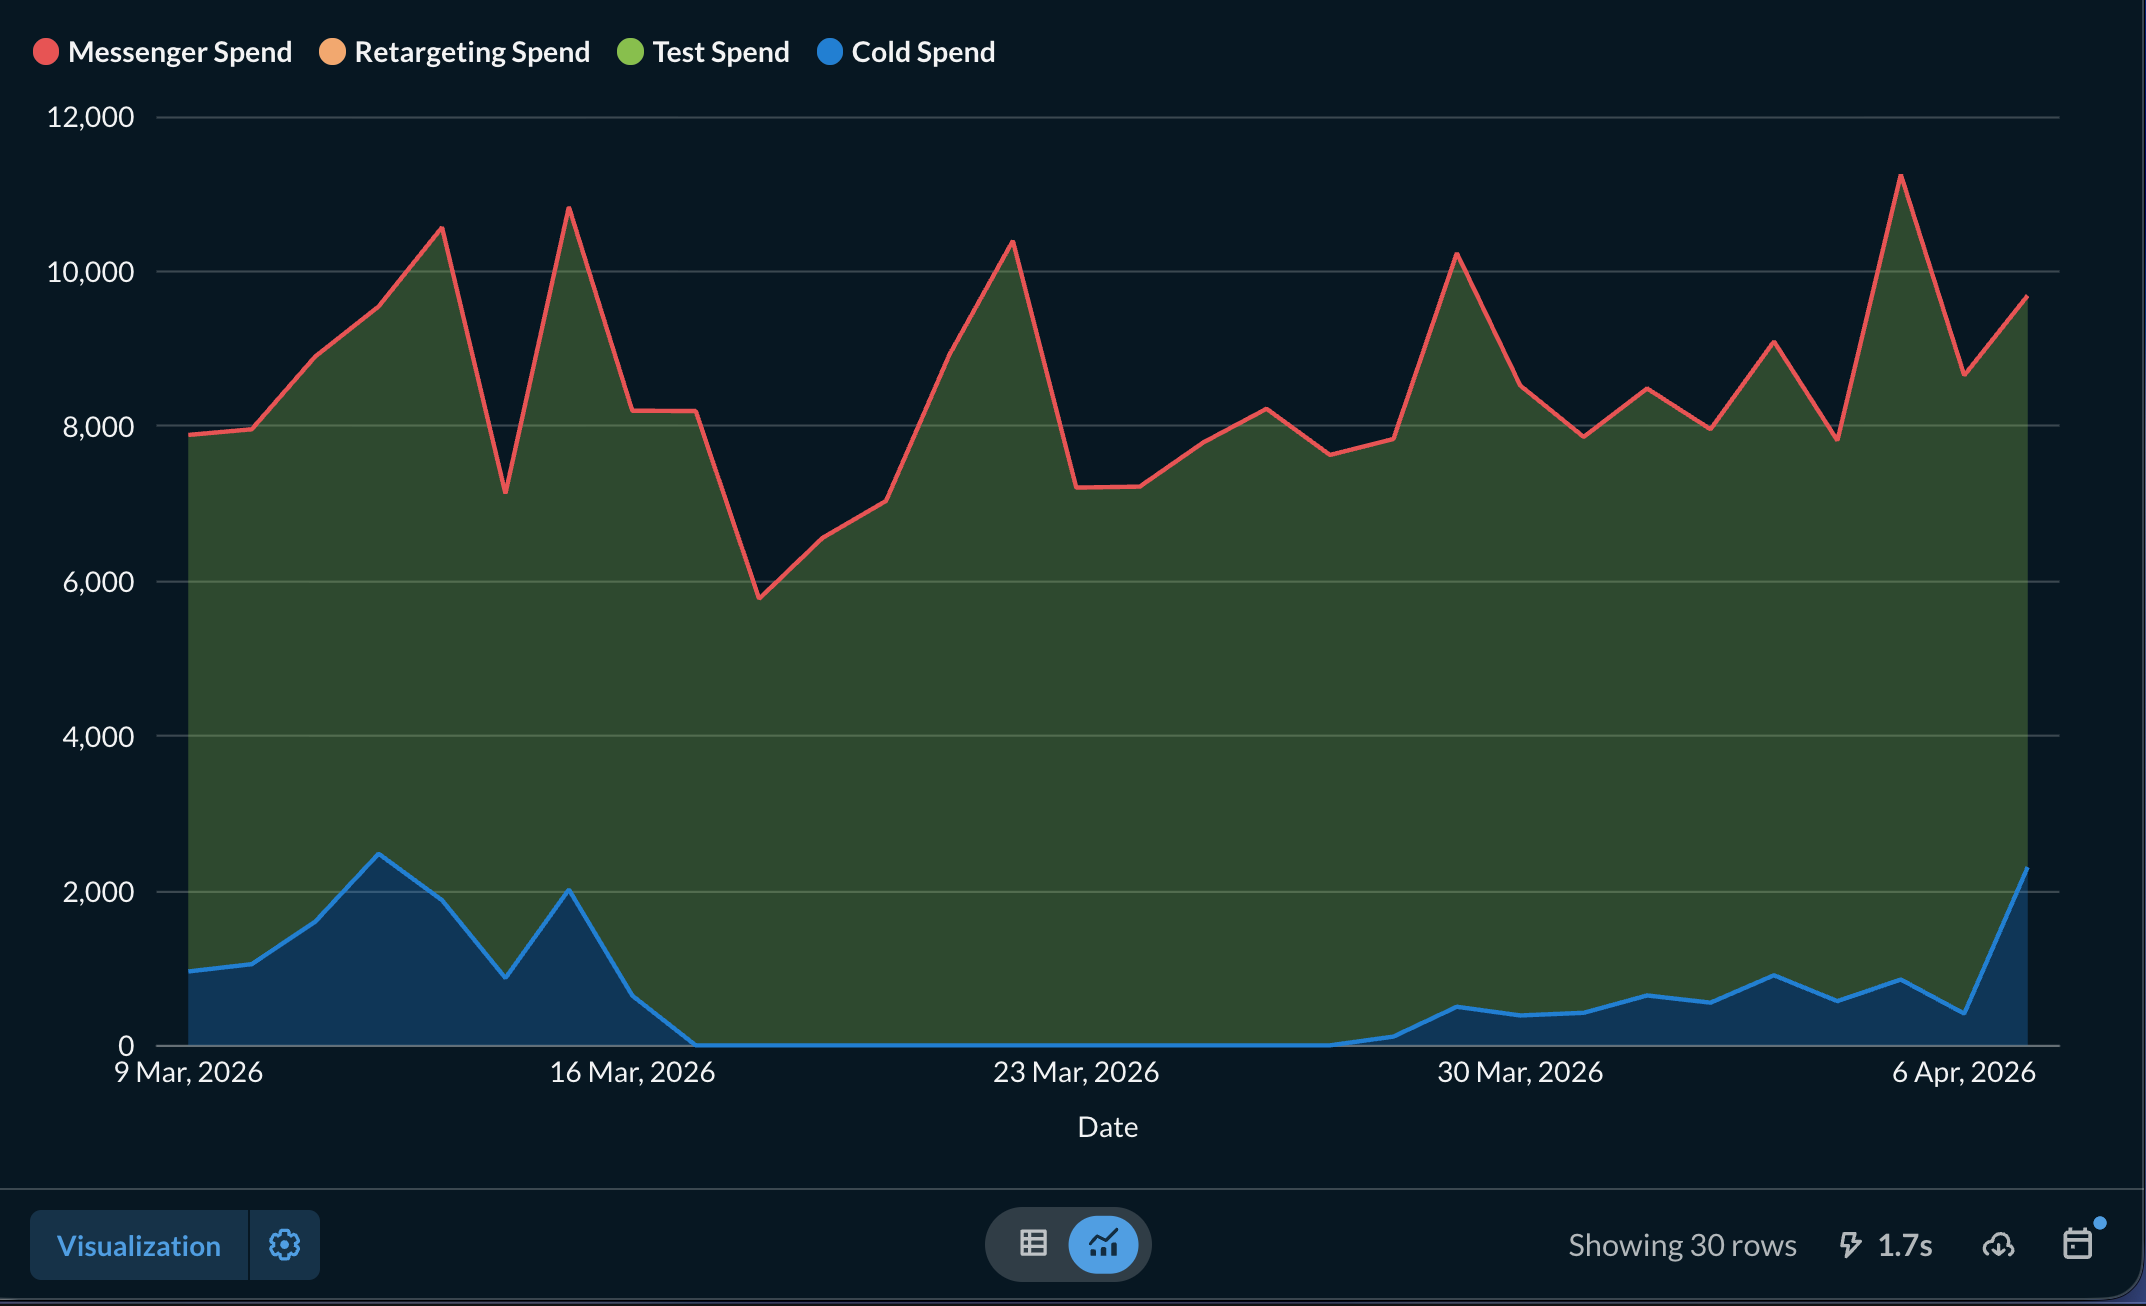
Both screenshots are from the same queston, one in the editor, one on a dashboard. I set the display as Auto-Y-Axis, but it doesn’t show on the dashboard and shows Max Y -Axis as 1. Any fixes or workarounds? Dashboards are now unusable.
Try replacing the question with itself in the dashboard. This will reset any dashboard-specific visualization settings.
This topic was automatically closed 3 days after the last reply. New replies are no longer allowed.