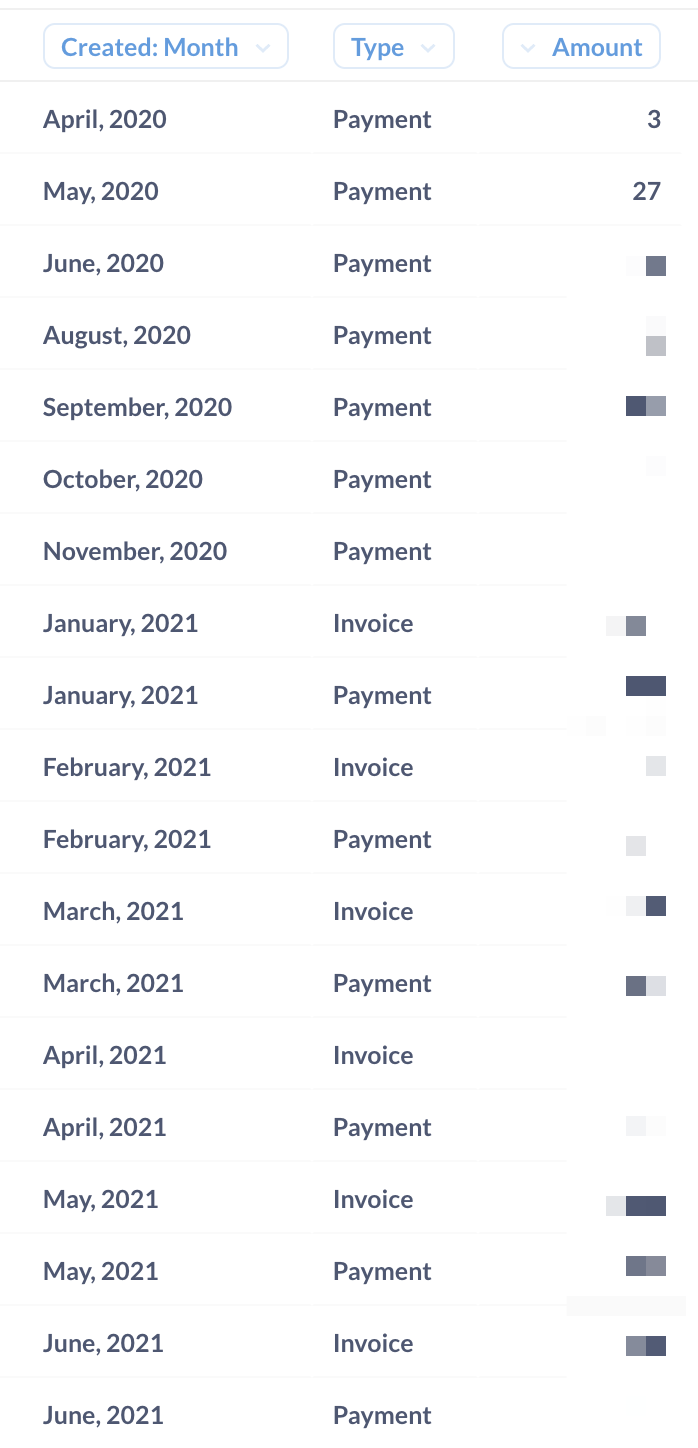
I have a data set that looks like this, where Type is a custom column with the formula case(isempty([Invoice ID]), "Payment", "Invoice")
When I try to group a line chart by Created and Type, I get an error:
"Created" is an unaggregated field: if it has more than one value at a point on the x-axis, the values will be summed.
and although the line chart is displayed, I don't have separate lines for each type, all data points are labelled as invoice.
I can group other charts in the same way based on text columns so I'm not sure what's causing the issue here?