I have this graph that I can make either way stacked or unstacked
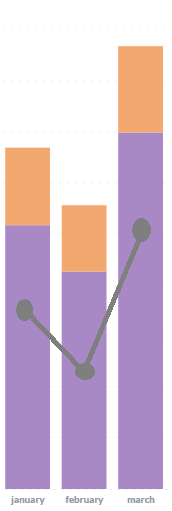
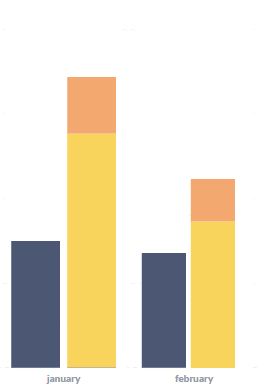
Stacked graph:
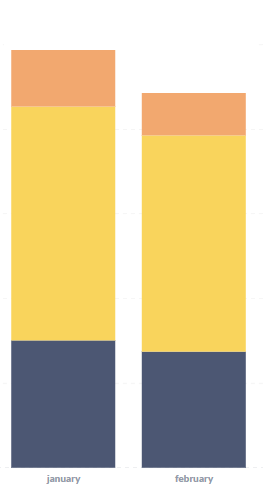
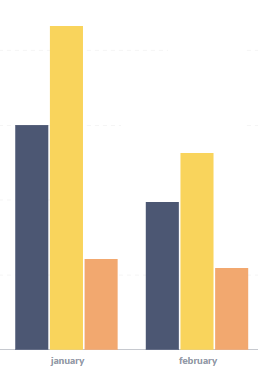
Unstacked graph:
It combines 2 questions:
Dark blue = Question 1 (year n-1)
Yellow & Orange = Question 2 (current year)
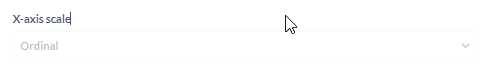
And I would like to achieve this result instead:
Whenever I merge both questions on a dashboard. The final visualisation decides either to stack all bars or unstack all bars.
Is it possible to stack only specific bars? If yes how? Maybe some kind of "complex" native query?
If not, do you have any tricks to achieve an alternative solution?
Someone helped me to achieve the kind of result I was looking for by changing the date format.
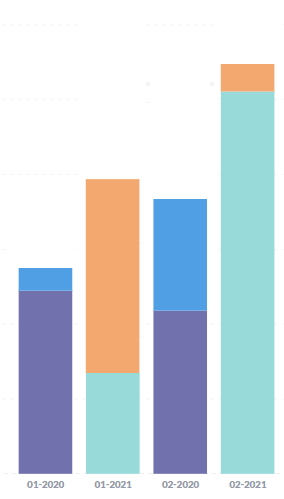
Instead of merging everything on monthname, date are now mm-yyyy which allows to split year -1 and current year then use an ordinal x-axis scale to sort it in the right order.
 on the first post