Hi metabase community,
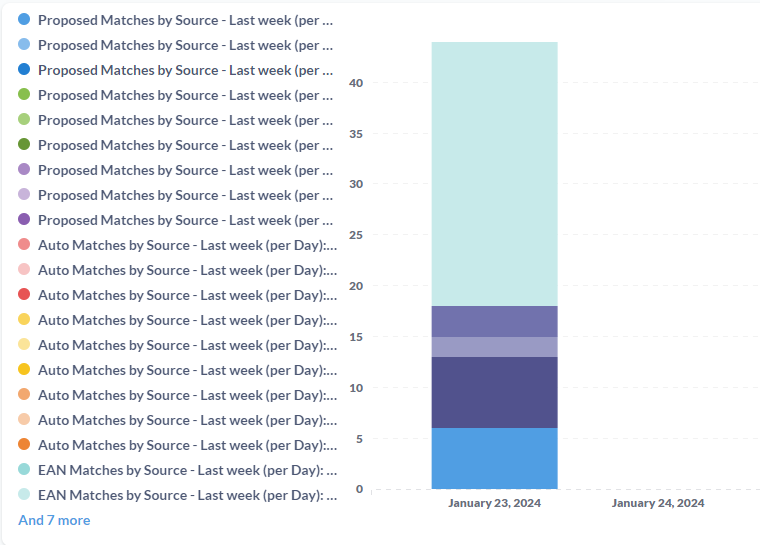
I've successfully managed to combine multiple series in a dashboard. The data is as I envision it, but I have a forest of labels on the left side which are quite overwhelming. Is there any way to hide or toggle them, since you get all relevant information from the tooltip?
Thank you for helping me out!
Sylvia