Hello guys. We are currently facing high CPU usage problems using ECS. More details about our instance below.
The use is the same as it was historically, same as active users, but only recently we've being experiencing that situation that the CPU usage turns about 100% several times a day. I have a suspicion that the Cache feature from Metabase is creating those issues. Watching Troubleshooting/Logs we can see multiple times that message in cpu usage spikes: INFO metabase.query-processor.middleware.cache.impl Results are too large to cache. . We turned off cache for saved questions for a moment to check if the instance gets more stable.
Do you have any suggestion of what we can do or check in our ECS or Metabase configs?
Thanks.
Detailed Info:
Metabase Version: v0.48.1
SQL Engine: Athena
Metabase Features:
-- Cache active for saved questions (Minimum query duration: 30s, TTL Multipllier: 720, Max Cache Entry Size not set)
-- X-ray features: disabled
Connection Features:
-- Rerun queries for simple explorations: disabled
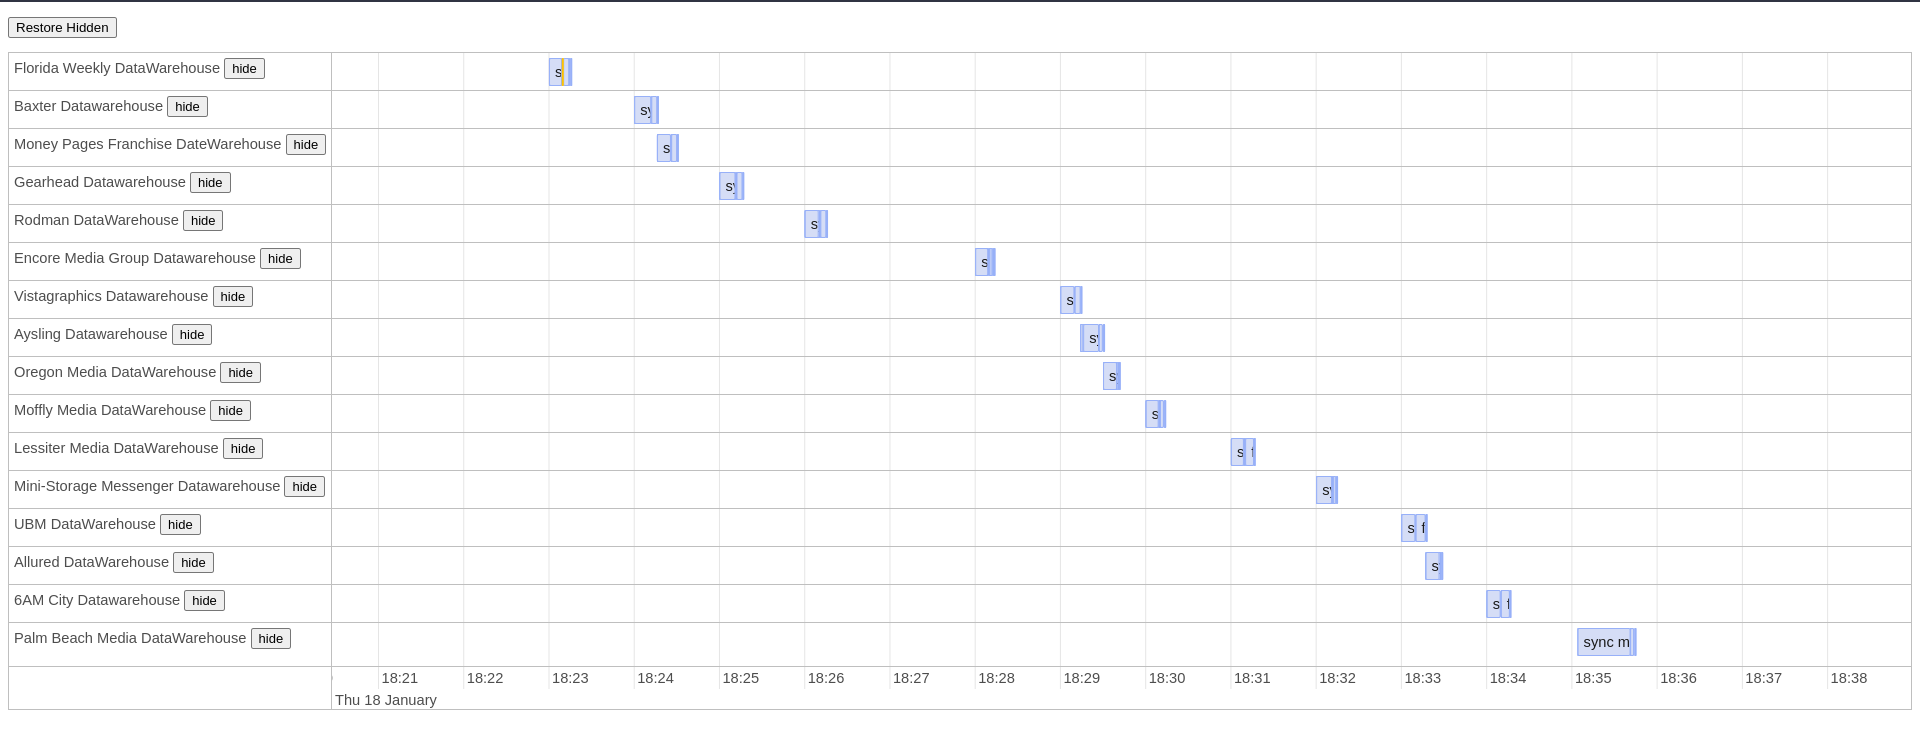
-- Choose when syncs and scans happen: enabled
-- Scanning for filter values: regularly, on a schedule
-- Periodically refingerprint tables: enabled
Just to update our situation, we duplicated CPU / Memory in ECS to 4 vCPU | 8 GB. As a consequence, it seems that our peak is around 82% now, and not 100% as before.
However, we are facing the " Results are too large to cache" problem massively.
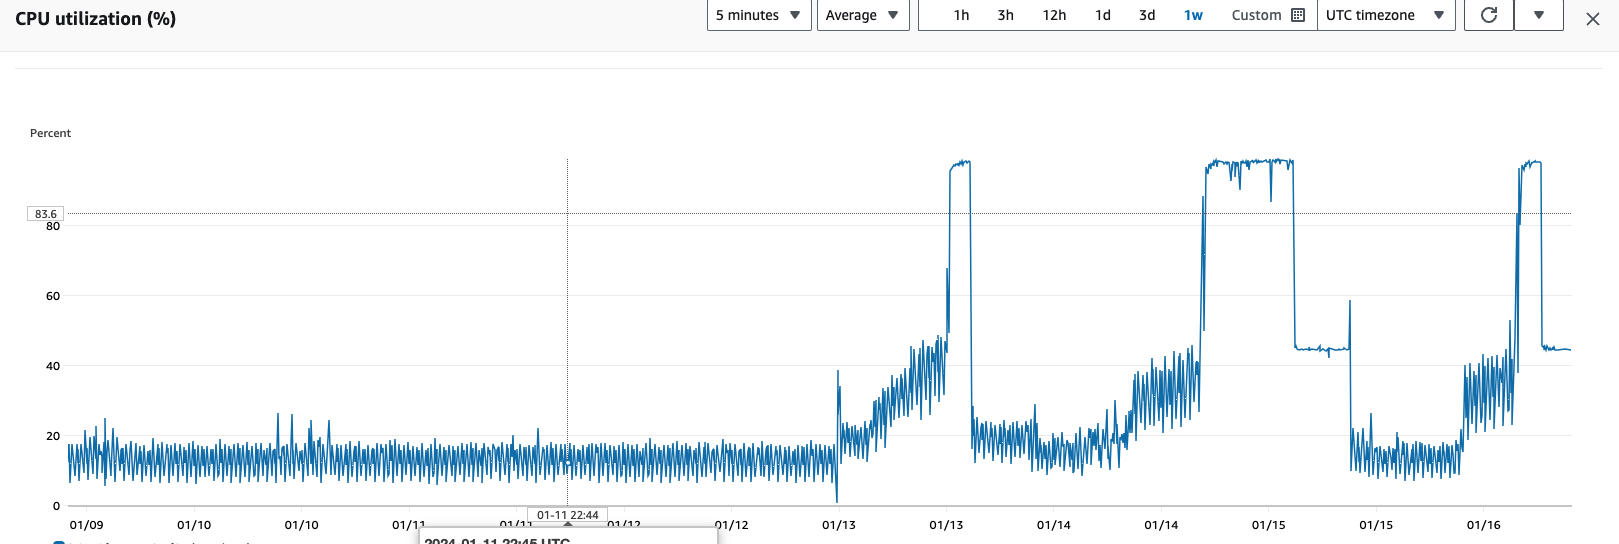
Did 0.48.3 resolve the CPU issue for others? It did not for us. Since we upgraded to 0.48.x we have had unexplained CPU spikes that are only resolved after stop/restarting. I've attached a graph of CPU usage for the last week the upgrade happened on 1/13/2024.
sure, we can provide them to you. Do you want them when the spike first occurs or throughout the entire event which seem to be anywhere from 30 minutes to 2 hours in duration.
sorry for the delay we had put in an automated process to restart the service every 6 hours to avoid the CPU spike and have had to disable that. will try to get the log data to you as soon as possible.
As an aside we did see this message in the logs that it indicated we should report:
we have a log file and image of the CPU usage at the time of the event. but there does not appear to be a way to upload a zip file here. if you have a place where we can upload the file let me know, otherwise we can put it somewhere you can download it.