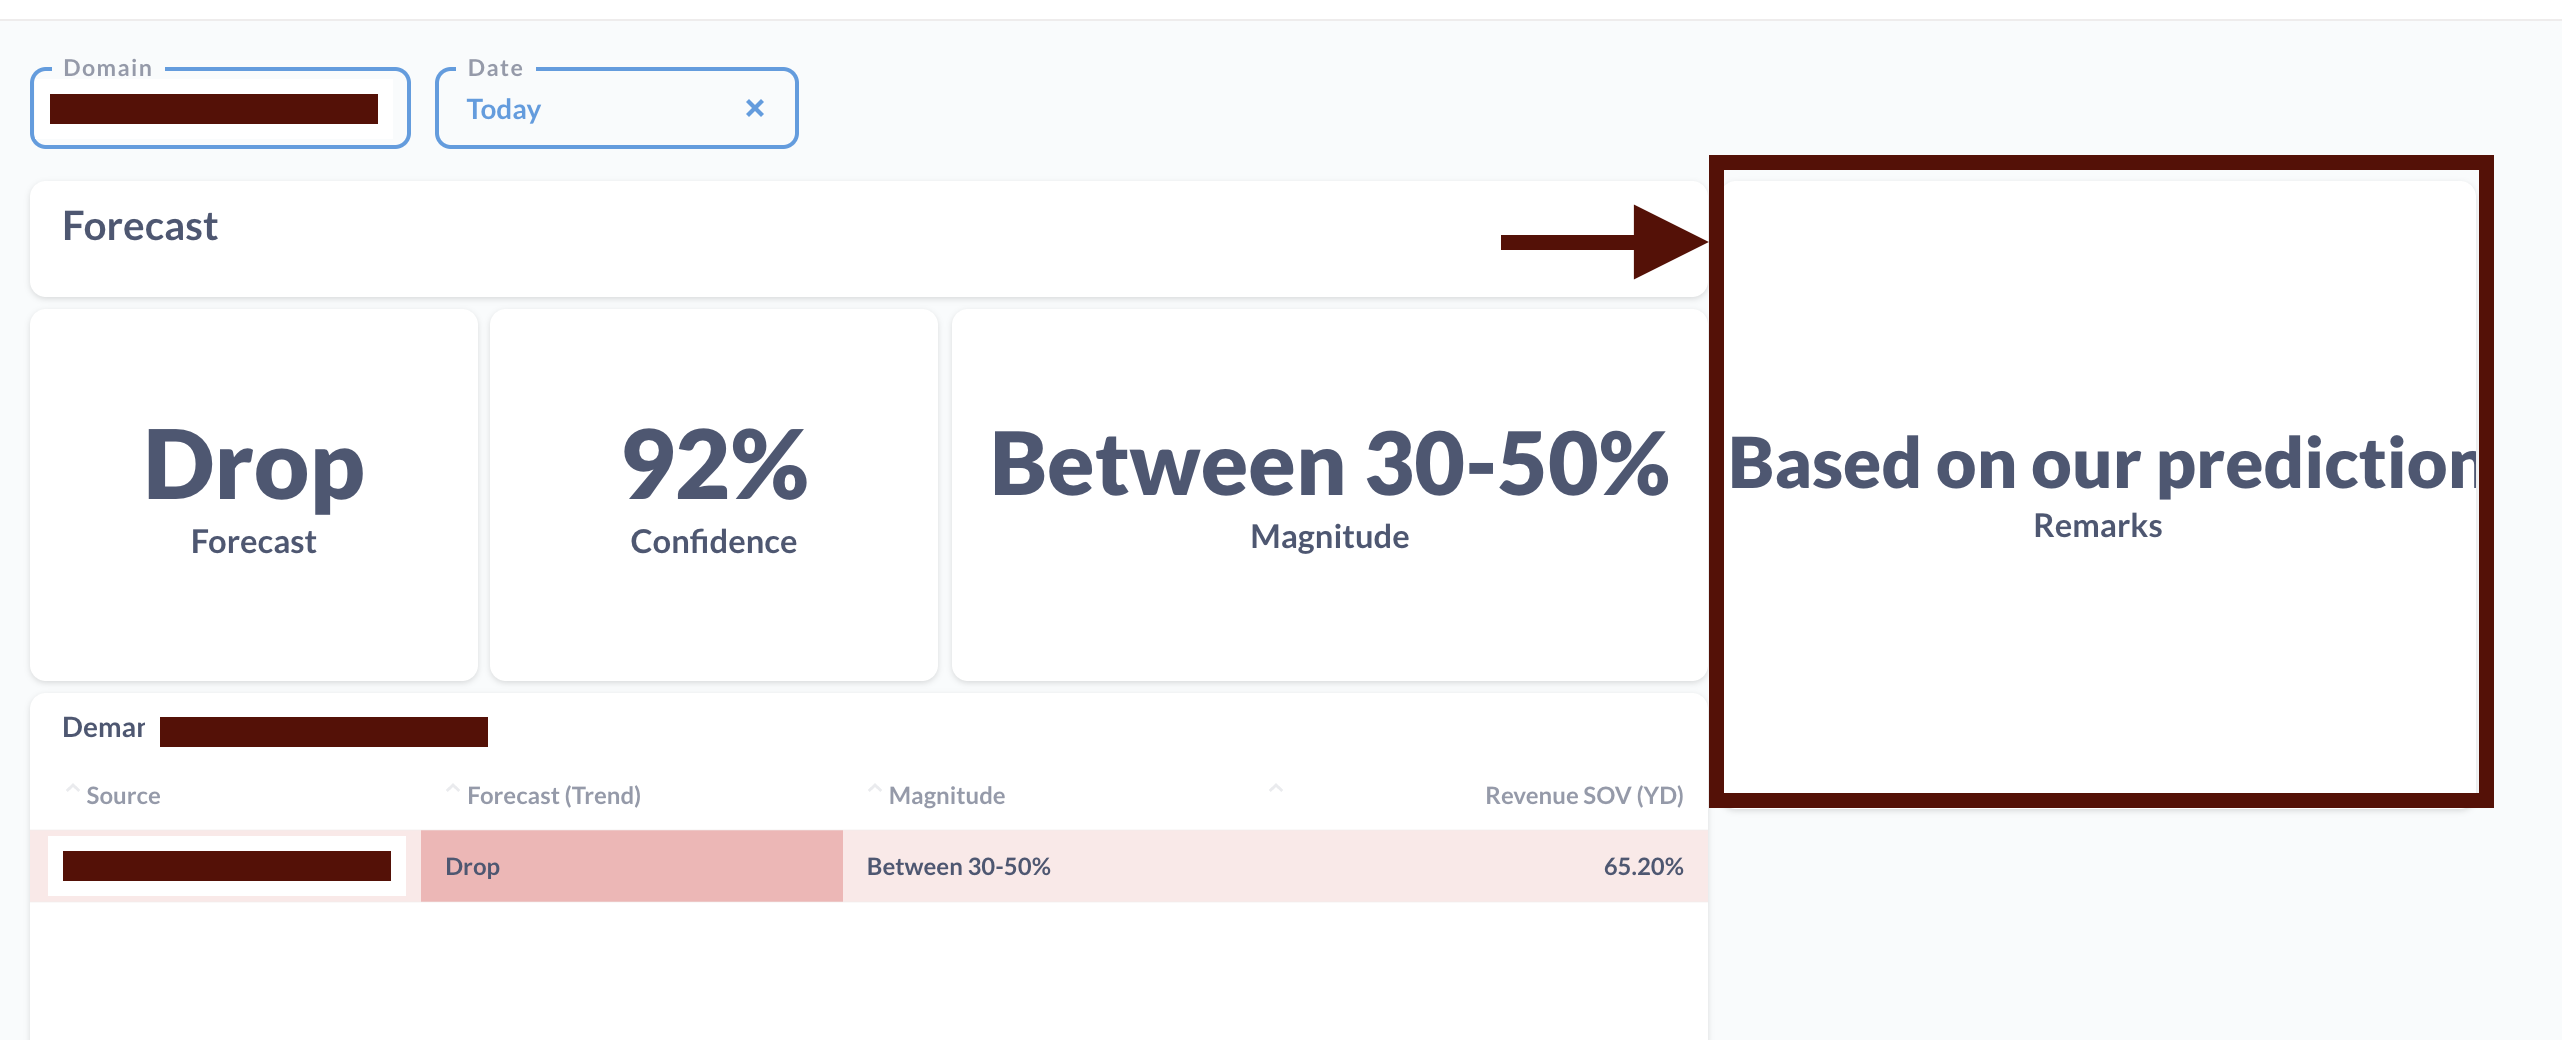
I have a dashboard where for every filtered category I have a single explanation coming from the database. Here's an example,
I have some data coming from which I am generating a chart but along with the chart, an explanation needs to be shown as well which changes for every chart. Since it is a single value, metabase considers it as a Number and because of that font size is very large and cannot fit in the area.
I already found out that we can add a variable in text area but that value comes from a filter.
So can someone help me in solving this? Attached screenshot shows the paragraph coming from db.
thanks for the response. as mentioned in the question, text card can only accommodate values used in filters but that's not what I have to show. so basically, text card can only have variables which are being used as filters. My use case is not certainly a filter.
Hi, I have the same issue.
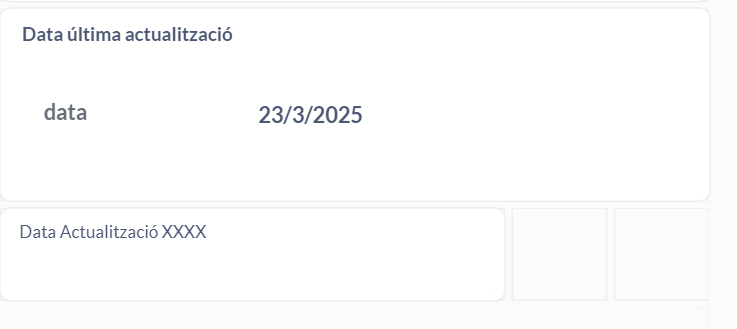
I would like to add a note in my Dashboards with de Update date.
with a card is to big for what I would like to be. With a text card is more "fine"
but how I can put the result in a text way? I tested detailed version as you recomended but... still dont'l like the format. thanks!