Hi guys, good morning!
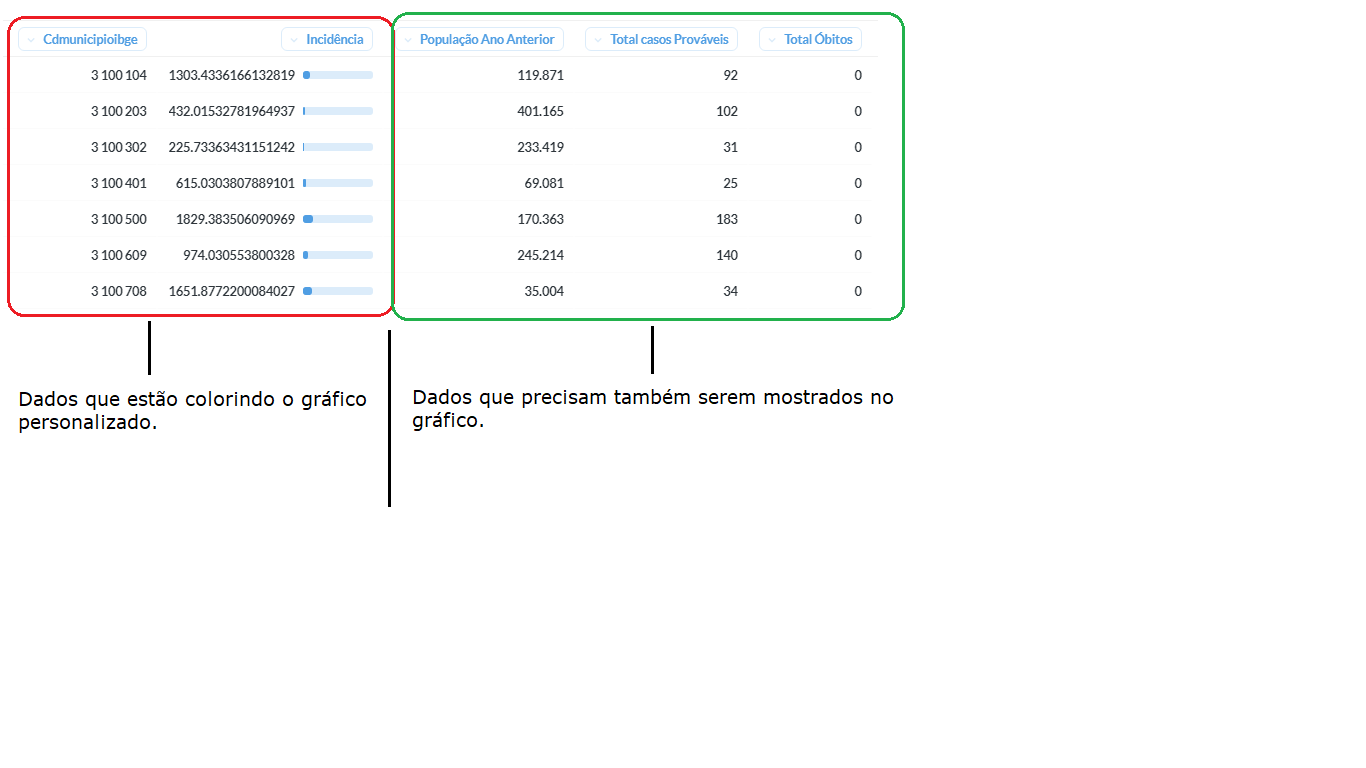
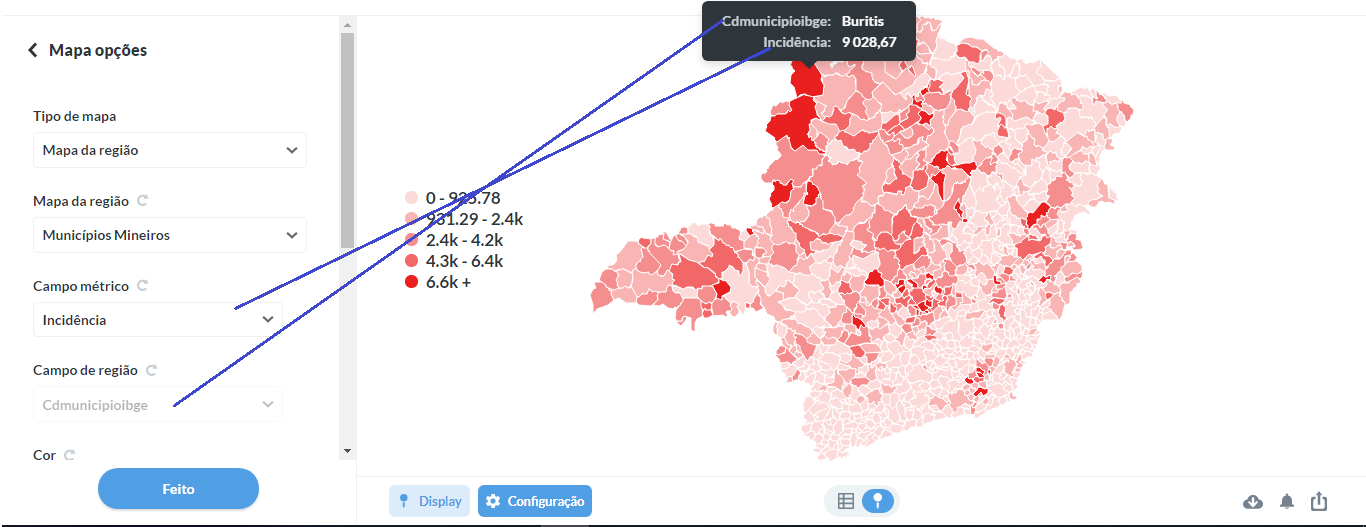
In the annexes below, I have a personalized graphic that uses IBGE code to color the map, according to the values of the Incidence metric. It also has other data (metrics) that I need to be shown on the same graph. How to make?
Hi @Lourival
It is currently not possible to show multiple columns on the same map, since it’s coloring the regions based on the specified column.
You’re welcome to open a feature request: https://github.com/metabase/metabase/issues/new/choose
Thanks @flamber, I will make the request, as per your suggestion.
Just for reference:
https://github.com/metabase/metabase/issues/12308 - upvote by clicking  on the first post
 on the first post