Dear:
I want to build dashboard by SQL with param ,as pic which I upload.
when I use param As 2025,
the card use qution can’t show 3 year data
if I use sql to add card,it can get data by param, but the year, month on card doesn't by order
Is there any one can help me to reslove it.
THX
SELECT

/* 4. 格式化欄位:解決 2,025 分號問題與月份排序問題 */
  CAST(YEAR (T1.CREATED_AT) AS CHAR(4)) AS "資料年份",
  CASE
    WHEN MONTH (T1.CREATED_AT) < 10 THEN CONCAT ('0', CAST(MONTH (T1.CREATED_AT) AS CHAR(2)))
    ELSE CAST(MONTH (T1.CREATED_AT) AS CHAR(2))
  END AS "資料月份",

/* 1. 原始日期:這是製作「趨勢圖卡 (Trend)」與「時間序列」的靈魂,不能轉字串 */
  T1.CREATED_AT AS "訂單日期",
  T1.TOTAL AS "銷售金額",
  P.CATEGORY AS "產品類別",
  /* 2. 基準年:讓每一列都知道目前的過濾基準 (用於 Dashboard 連動) */
  COALESCE([[ {{year}}, ]] YEAR (CURRENT_DATE)) AS "基準年",
  /* 3. 年度分類:根據參數自動標記,這在樞紐分析或圖例中非常好用 */
  CASE
    WHEN YEAR (T1.CREATED_AT) = COALESCE([[ {{year}}, ]] YEAR (CURRENT_DATE)) THEN '3本期'
    WHEN YEAR (T1.CREATED_AT) = COALESCE([[ {{year}}, ]] YEAR (CURRENT_DATE)) - 1 THEN '2去年'
    WHEN YEAR (T1.CREATED_AT) = COALESCE([[ {{year}}, ]] YEAR (CURRENT_DATE)) - 2 THEN '1前年'
  END AS "年度別"


FROM
  ORDERS T1
  LEFT JOIN PRODUCTS P ON T1.PRODUCT_ID = P.ID
WHERE
  1 = 1
  /* 關鍵過濾:確保資料庫抓出基準年及其前兩年,且不受 Dashboard 自動過濾干擾 */
AND YEAR(T1.CREATED_AT) >= (CAST(COALESCE([[ {{year}}, ]] YEAR(CURRENT_DATE)) AS INT) - 2)
  AND YEAR(T1.CREATED_AT) <= CAST(COALESCE([[ {{year}}, ]] YEAR(CURRENT_DATE)) AS INT)

--ORDER BY YEAR(T1.CREATED_AT) ASC, MONTH(T1.CREATED_AT) ASC
Sorry, trying to work through the language barrier, apologies for any errors.
If you want the output to be ordered, you must use an ORDER BY clause. If you want to order by month, then use ORDER BY MONTH(T1.CREATED_AT). I think you figured this out near the end of the last notebook page.
If you have multiple years in the data but they aren’t plotting, check the visualization settings and make sure the axes columns are set correctly. Below one of them appear a link to either “add a breakout” or “add a series”; click that and the individual years should appear as separate lines/bars/colors.
Dear
Thank for your replay.
As I post, If I user order by in SQL, It show 1 year on dashboard.
There is no option let me to set on lines/bars/colors.
Maybe you can use my sql sctipt and try it by the pic I post,You will Know what I talk.
Should yo show me how to do it by pic?
Thx
It seems like you’re using the query you pasted into the first post as a saved query data source. The downside of this route is that you don’t have access to the filter in the base SQL query.
If you want to keep the filter, you’ll need to combine the queries. If you want to keep the base query reusable, copy it into a Snippet and include that Snippet in a second SQL query that does the necessary summarizations. You can use the query generated by a notebook query as a pattern.
Directly ordering the original query is losing data because its hitting the result row limit. That’s why your graphs are missing months when you apply the ordering. You need to do some summarization in the database. You can sort the sums and it’ll work properly.
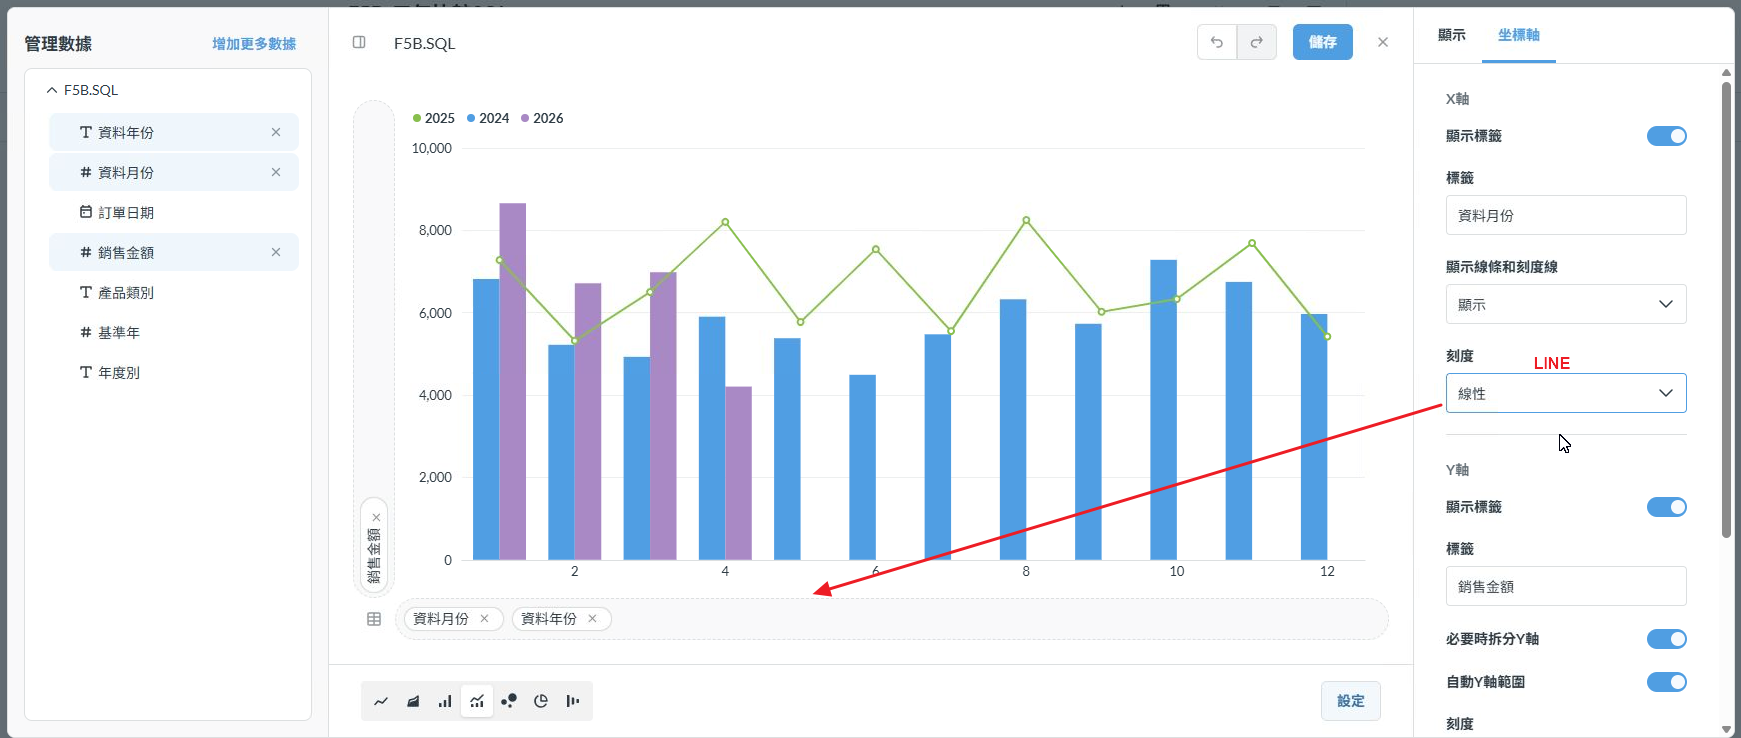
Last tip I have is that if the X axis is showing every other label, go into the X axis settings and change the X axis type to Ordinal.
Dear:
- could you so kindly o show me how to build sql script?
I just want to a query cloumn to query 3 year
If I type 2026,then it show 2024,2025,2026
if i type 2025,then it show 2023,2024,2025
could it be maded?
2.In card , I use MONTH (T1.CREATED_AT) "data_month",
and the Ordinal option show as the pic, the month doesn't ordering
thx