Hi everyone -
I'm new with Metabase. I created a dashboard and used bar chart for that. One issue facing is i don't know how to change alignment of chart axis to make it more easier to read (like excel, we normally change text direction of axis).
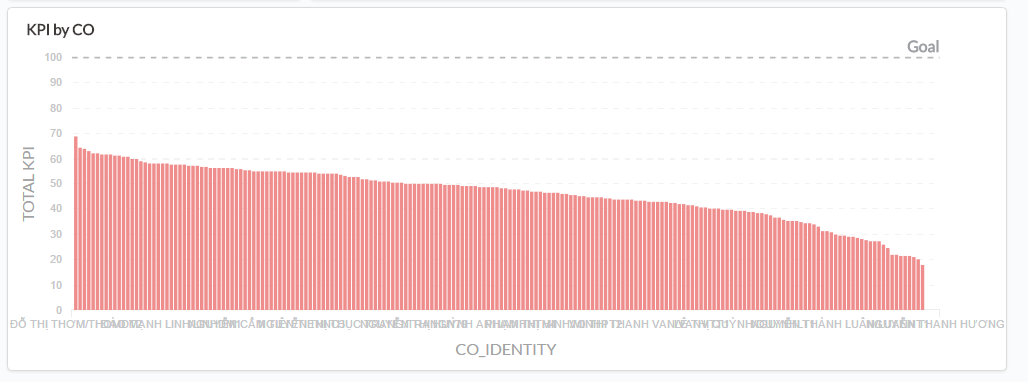
I'm attaching my example for easy viewing as below picture. Hope anyone can help ?
Thanks in advance !
When you have lots of categories on your x-axis like this, you could try using the new row chart visualization option which you can select from the visualization dropdown in the top-left of the question screen.
We might even want to think about having Metabase automatically default to row chart view if the breakout dimension has many values, and isn’t time or a continuous numerical value.