I would like to create the bar which will show the details of product details and count as shown in the below image.
I don't know how to achieve the same chart by using the local metabase version with sample data.
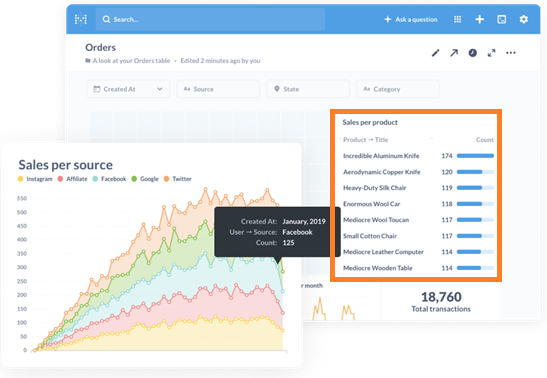
Do you want to create a bar chart or the chart in the image? The chart in the image isn't actually a bar chart, it's a table.
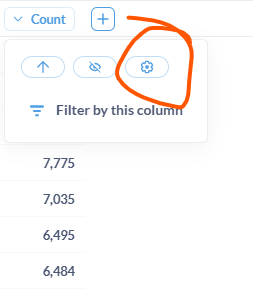
Create table dataset then click on the cog on the column
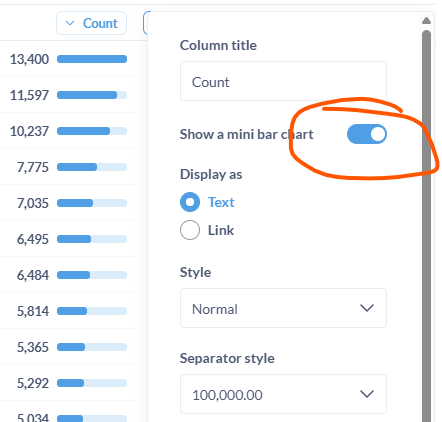
Then click on 'show as a mini bar chart'
1 Like