Hi everyone,
I’m trying to create a chart in Metabase that looks like a grouped + stacked bar chart, and I wanted to check if this is currently possible.
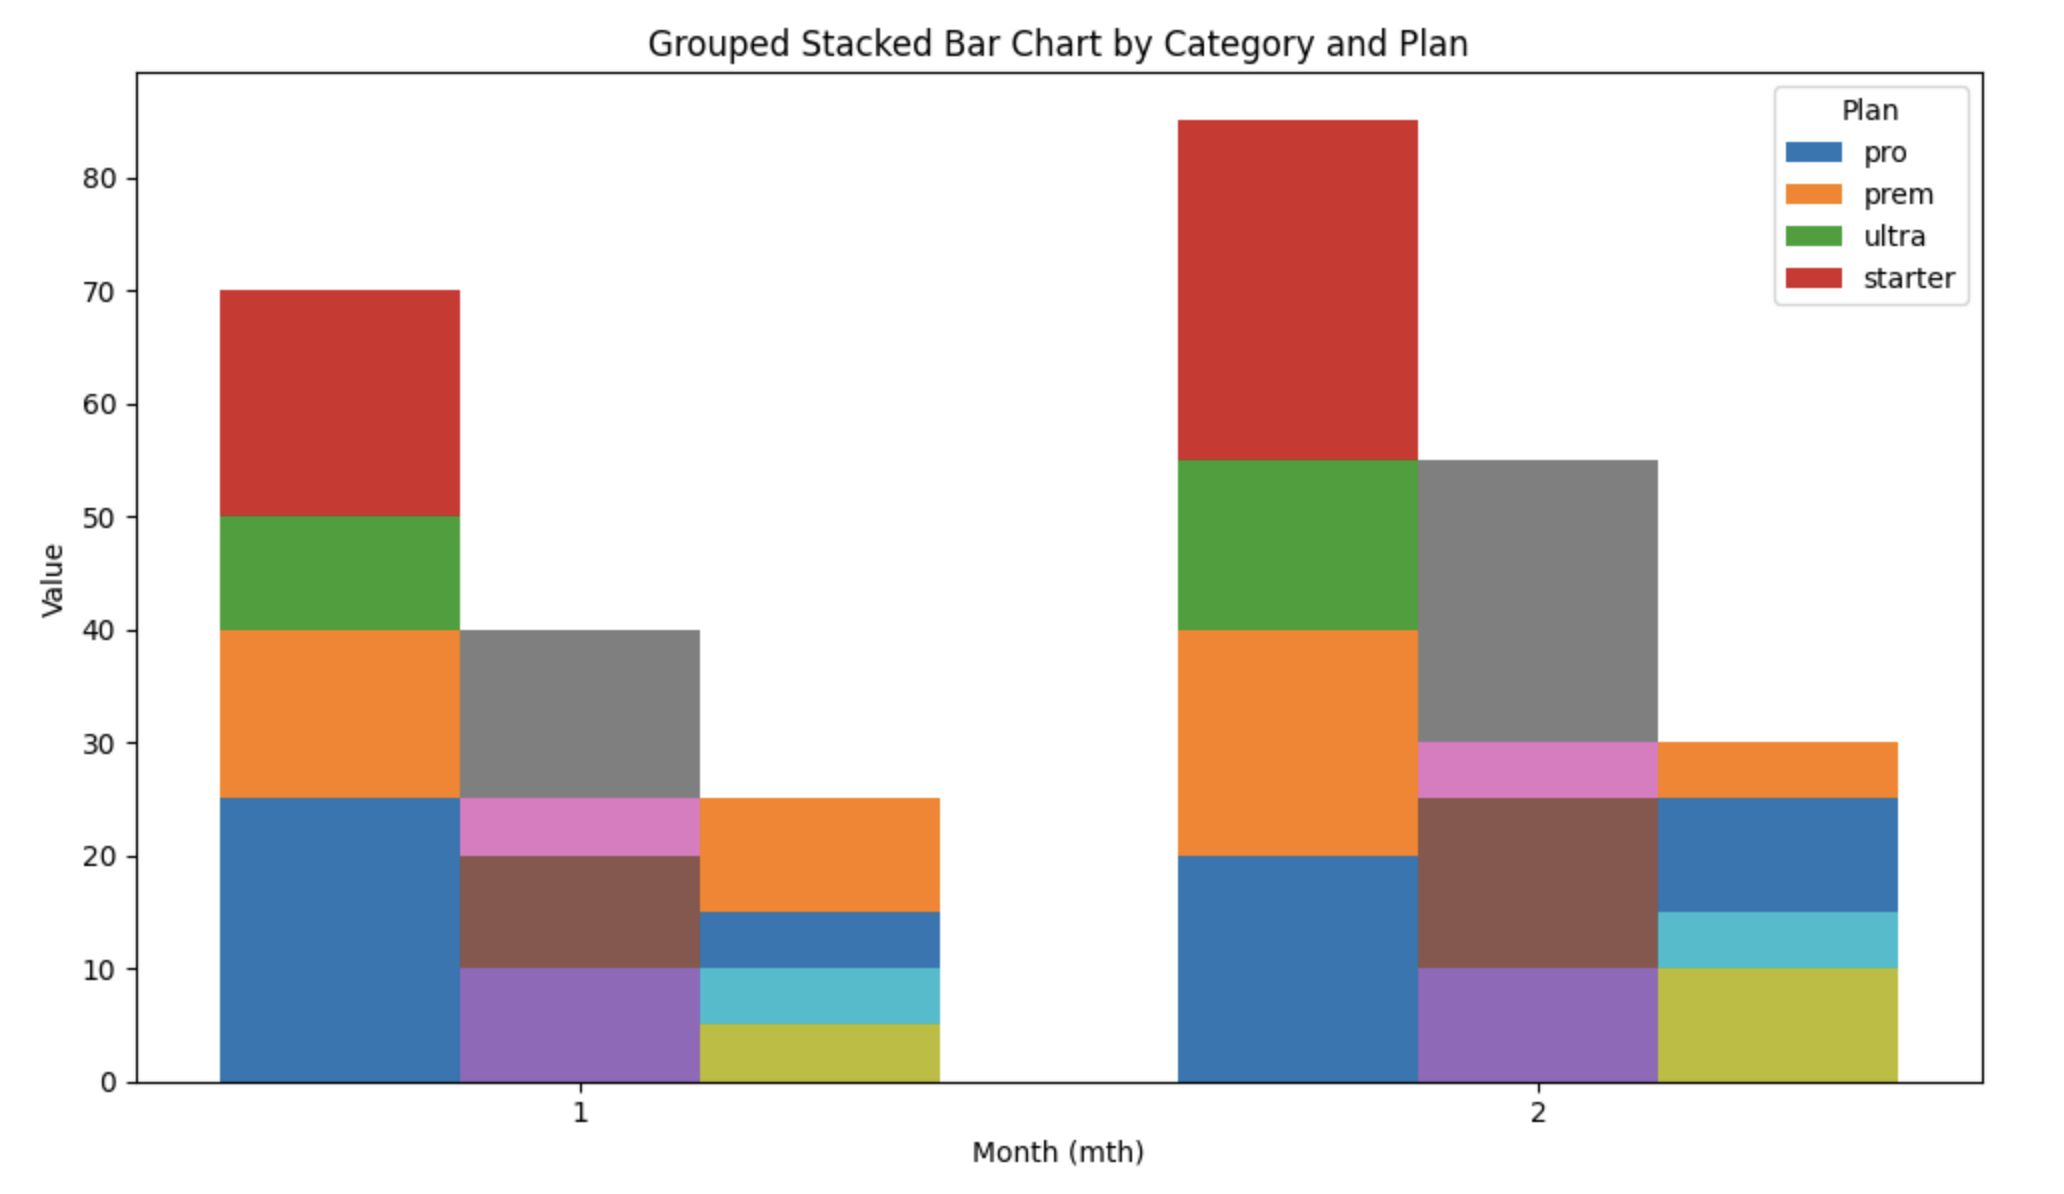
What I want to achieve:
For each value on the X-axis (e.g., mth), I want to display multiple bars side-by-side, and within each bar the values should be stacked by another field.
Example data:
mth | category | plan    | val
----+----------+---------+-----
2   | overall  | pro     | 20
2   | overall  | prem    | 20
2   | overall  | ultra   | 15
2   | overall  | starter | 30
2   | co_site  | pro     | 10
2   | co_site  | prem    | 15
2   | co_site  | ultra   | 5
2   | co_site  | starter | 25
2   | custom   | pro     | 10
2   | custom   | prem    | 5
2   | custom   | ultra   | 10
2   | custom   | starter | 5
Desired chart output:
For each mth:
-
Create one bar per
category(e.g., overall, co_site, custom) -
Each bar should be stacked by
plan(pro, prem, ultra, starter) -
Y-axis shows total
val -
X-axis shows
mth
So for mth = 2, there would be three bars next to each other, and each bar would be stacked by plan.
Question:
Is this type of chart supported in Metabase?
Specifically:
-
Can Metabase display multiple stacked bars per X-axis value?
-
Is it possible without SQL hacks or custom embedding?
-
If not currently supported, is it on the roadmap?
Any guidance or workaround would be appreciated.