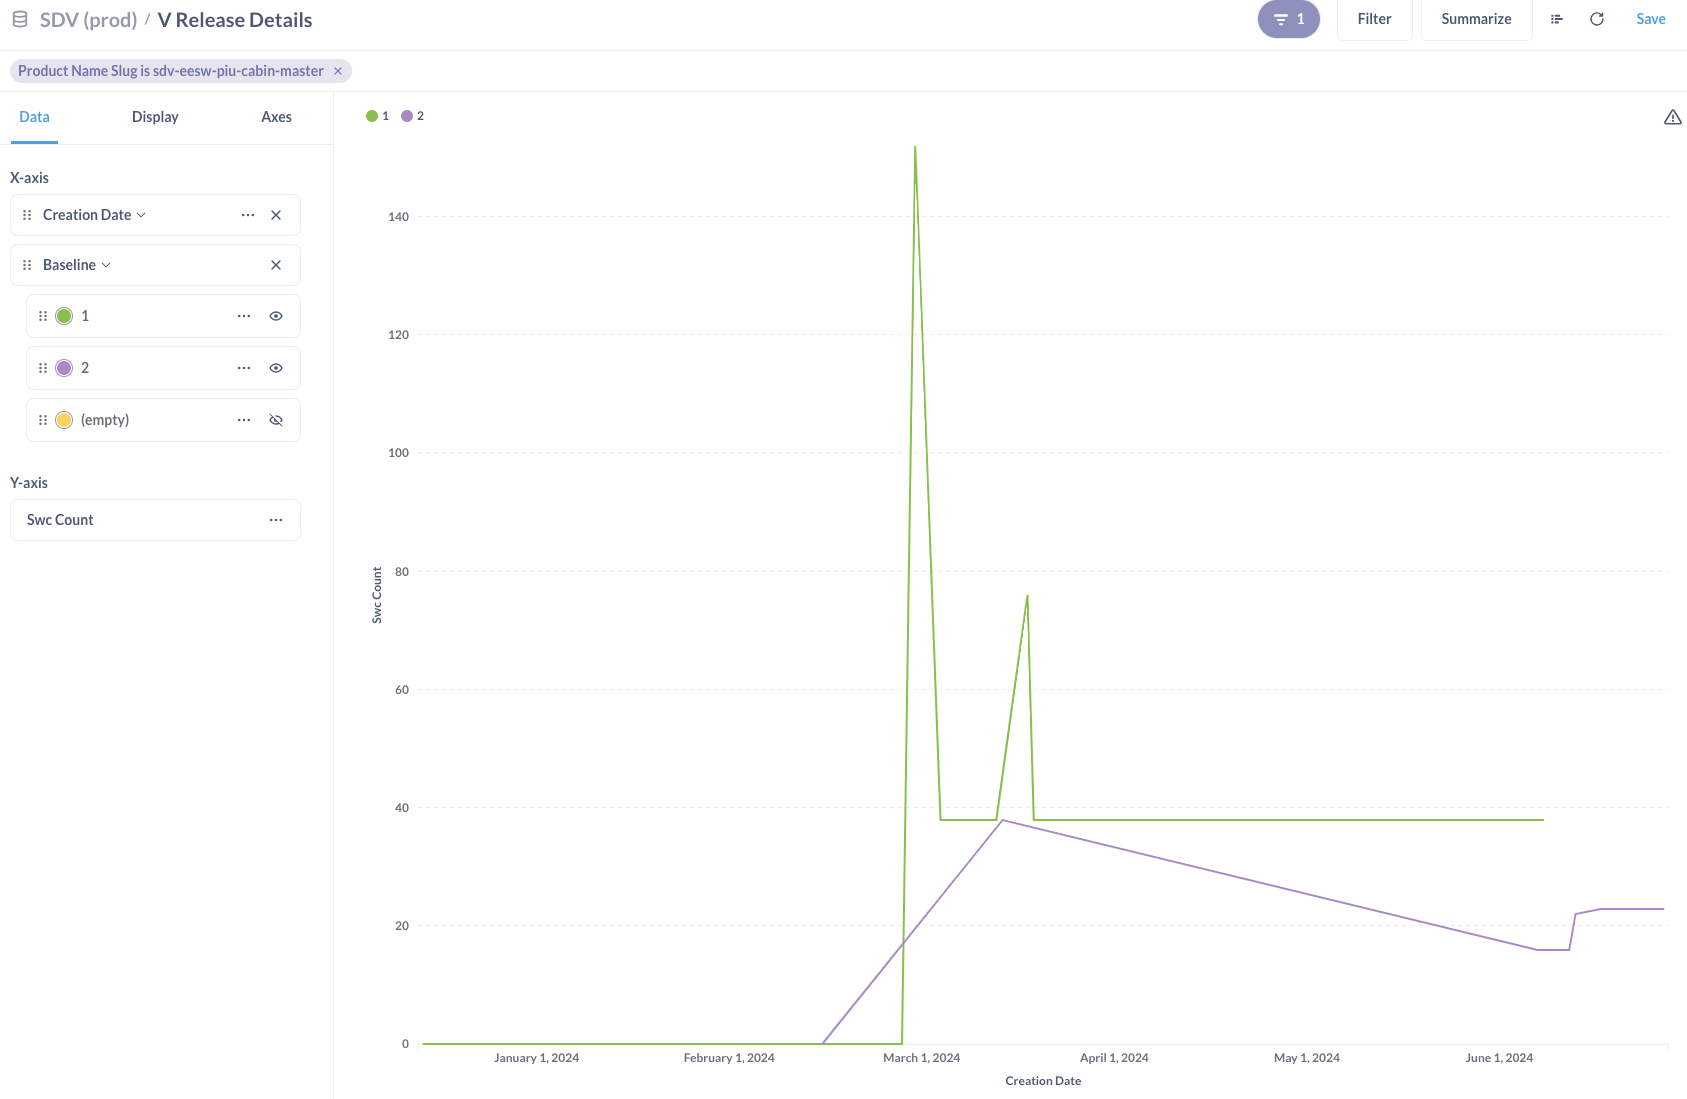
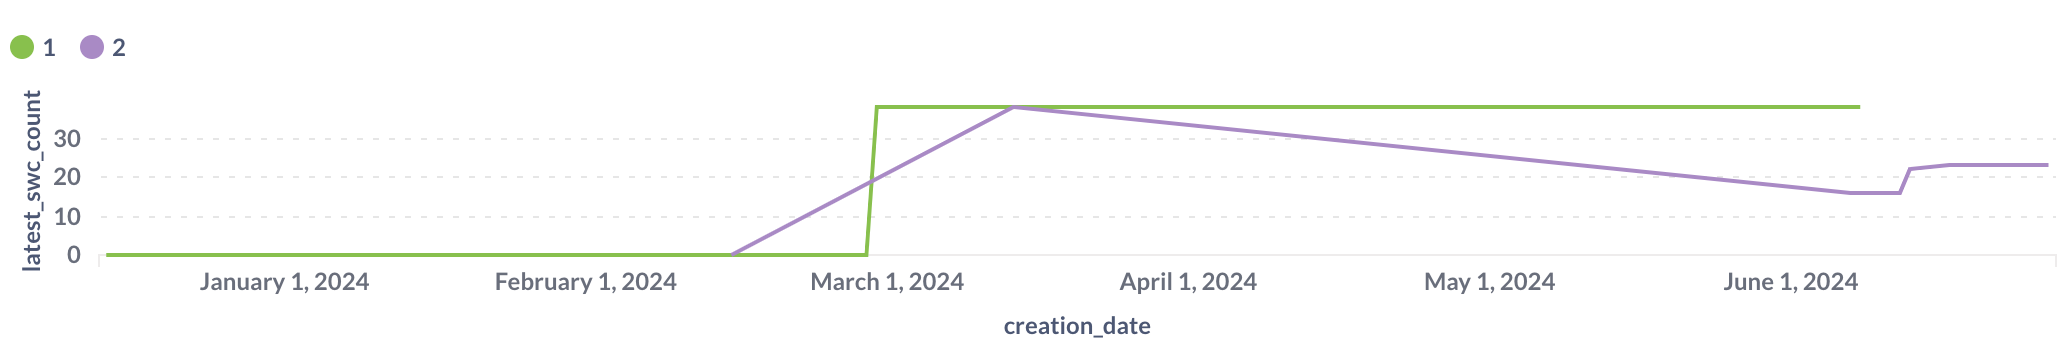
This displays the number of items produces by software releases, per day.
The thing is when there was 2 or more releases per day, the graph displays the sum of the items instead of just several points. How can i do to display several points in a single day, or at wort the latest of the day?
Behind that is a PostgreSQL database where my data is stored by release by release (i am storing information about software releases), with a created_at column.
But i need to add contextual data to the latest item of each day.
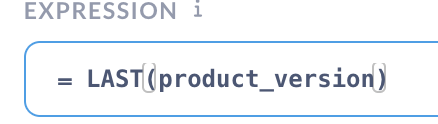
How can i tell to use a custom expression to select the LAST item in each group by?
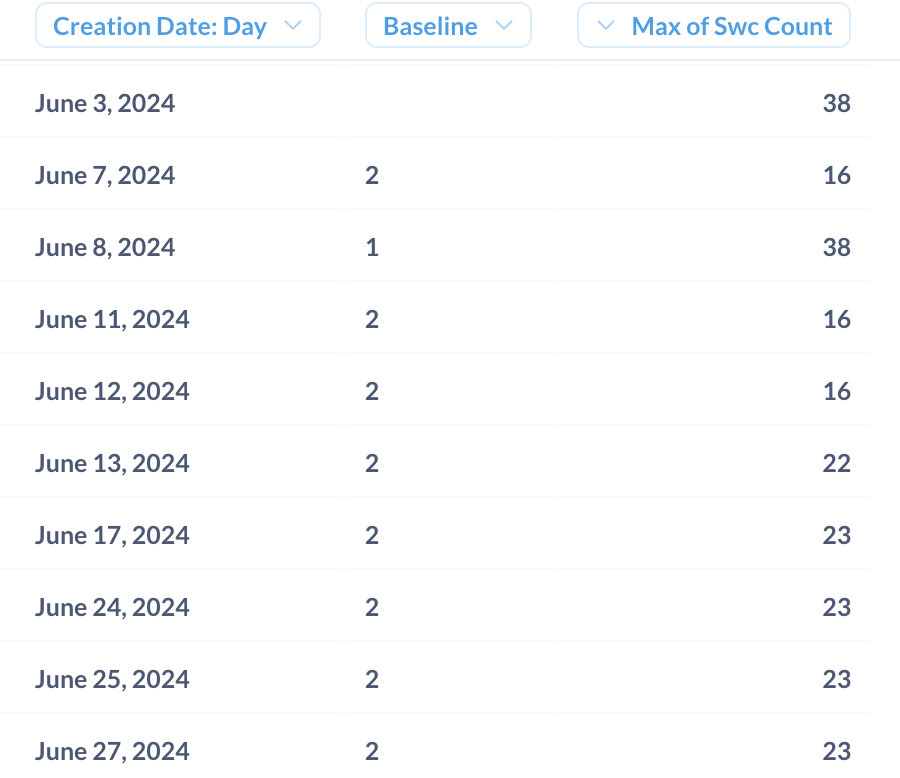
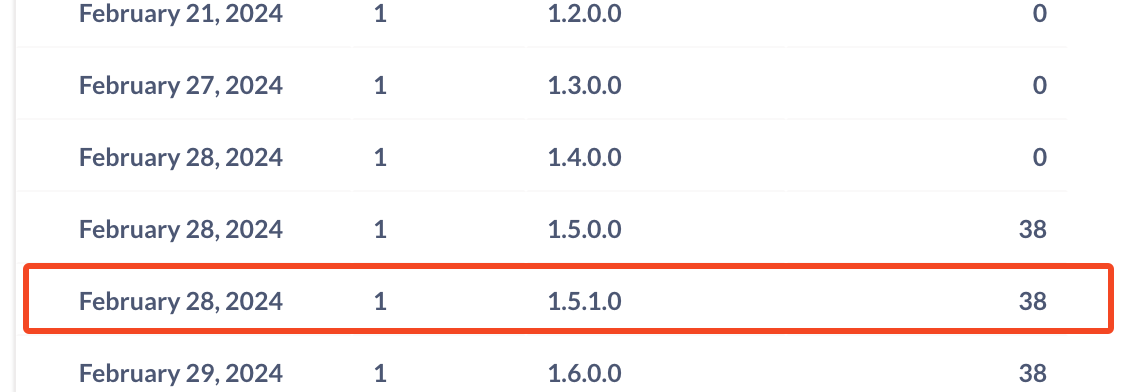
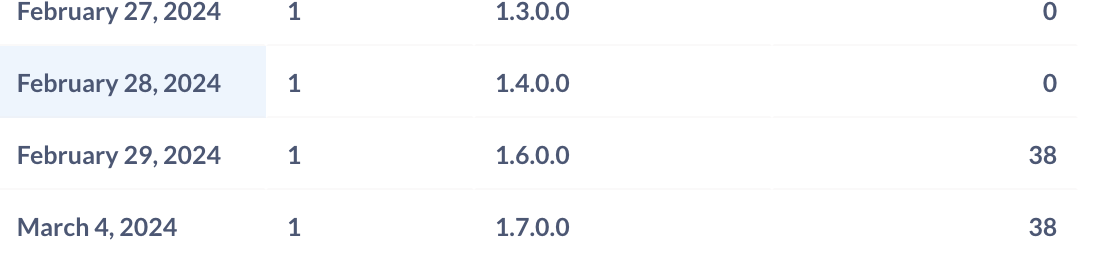
Said otherwise, i need in the following list to take the latest of every day, for instance for 28 feb, take the version 1.5.1.0 and ignore 1.5.0.0 and 1.4.0.0
This is hard to answer without knowing how your data is structured. You could try:
Adding a group for release and using it as an additional breakout
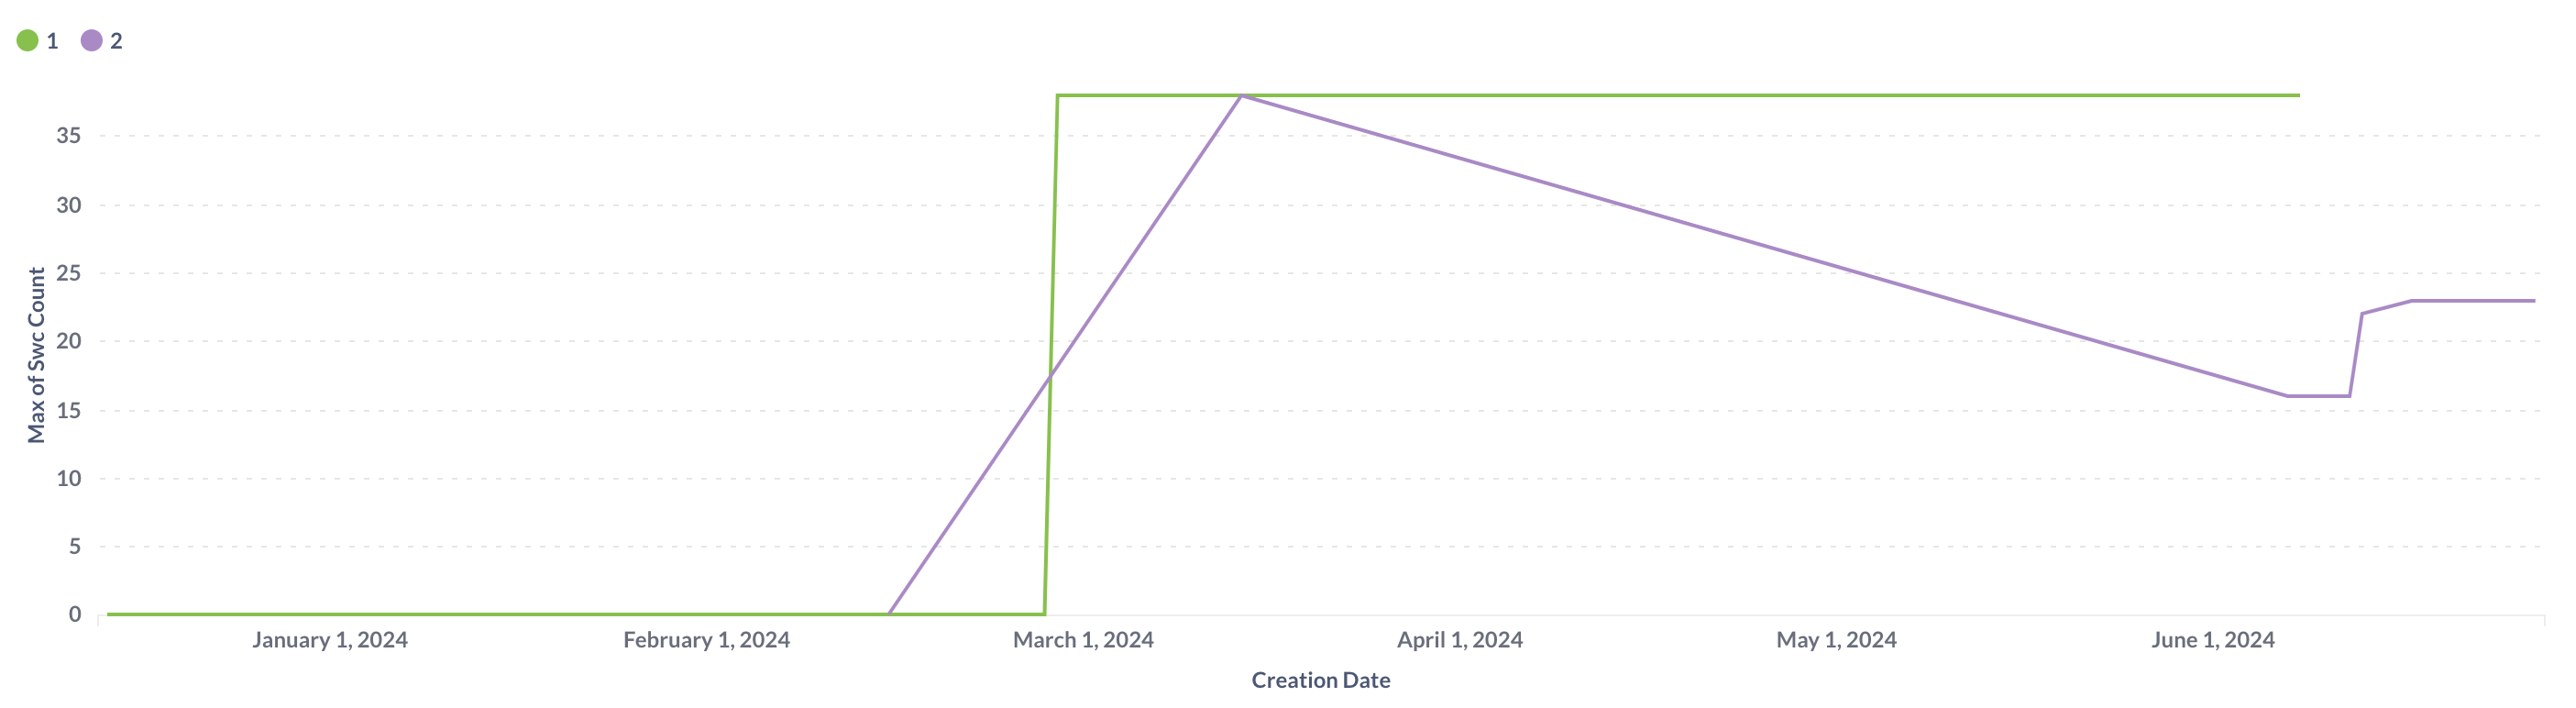
I wonder if you need to group by day and do a MAX() on release
Try using a different visualization type (like a scatter plot, maybe)
If you could share how the question is set up, what the data looks like and a simple mockup of what you want to the output to be it would be easier to help.
WITH LatestReleases AS (
    SELECT
        "v_release_details"."creation_date",
        "v_release_details"."baseline",
        "v_release_details"."product_version",
        "v_release_details"."product_name",
        "v_release_details"."swc_count",
        ROW_NUMBER() OVER (
            PARTITION BY "v_release_details"."creation_date"
            ORDER BY "v_release_details"."creation_date" DESC
        ) AS dt
    FROM
        "v_release_details"
    where
        "v_release_details"."product_name" = 'the-product-name'
)
SELECT
  "creation_date",
  "baseline",
  "product_version",
  "swc_count" AS "latest_swc_count"
FROM
  LatestReleases
WHERE
  dt = 1
ORDER BY
  "creation_date" ASC,
  "baseline" ASC,
  "product_version" ASC;
I need to be able to add a filter in the middle of the window function (WHERE product_name" = 'the-product-name')
I store release information, and if i do a visualization per days or weeks, only the latest really matter, and there as many contextual information i would like to display. Can a postgresql function help in this case?
SELECT
  "creation_date",
  "baseline",
  "product_version",
  LAST("swc_count", "creation_date")
FROM
  "v_release_details"
WHERE
  "v_release_details"."product_name" = "some-product"
ORDER BY
  "creation_date" ASC,
  "baseline" ASC,
  "product_version" ASC;
where LAST is an aggreation on the "swc_count" that order by "creation_date" and take the last line.
I am looking for a way to make it a postgresql function, but there is still the problem of the time chart adding its own GROUP by week for instance on top of the query. Can't it just reexecute the query ?