I found it a bit tricky to word this question succinctly, but here is an example of what I am trying to accomplish:
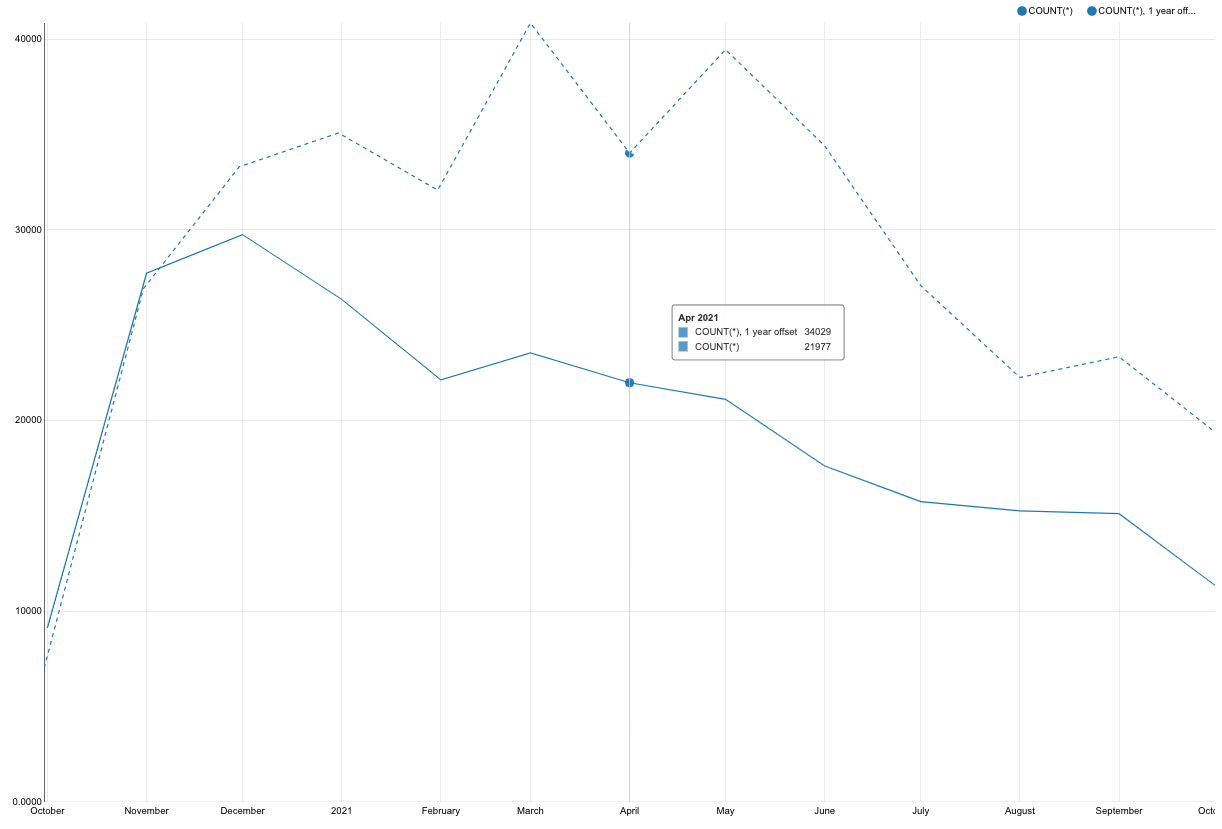
In Metabase, I am trying to recreate a feature that I've seen in other tools where you can visualize a series overlaid with the same series that has been offset / shifted by some time period, e.g. 1 year:
I have been able to create something like in Metabase (which looks a lot prettier) using SQL, but when it comes to doing it graphically with the notebook editor, I can only get part of the way there. For some additional context, I would like to be able to accomplish this with the notebook editor only, as there are others in my company would will likely be using / editing these dashboards in the future and are not that comfortable with SQL.
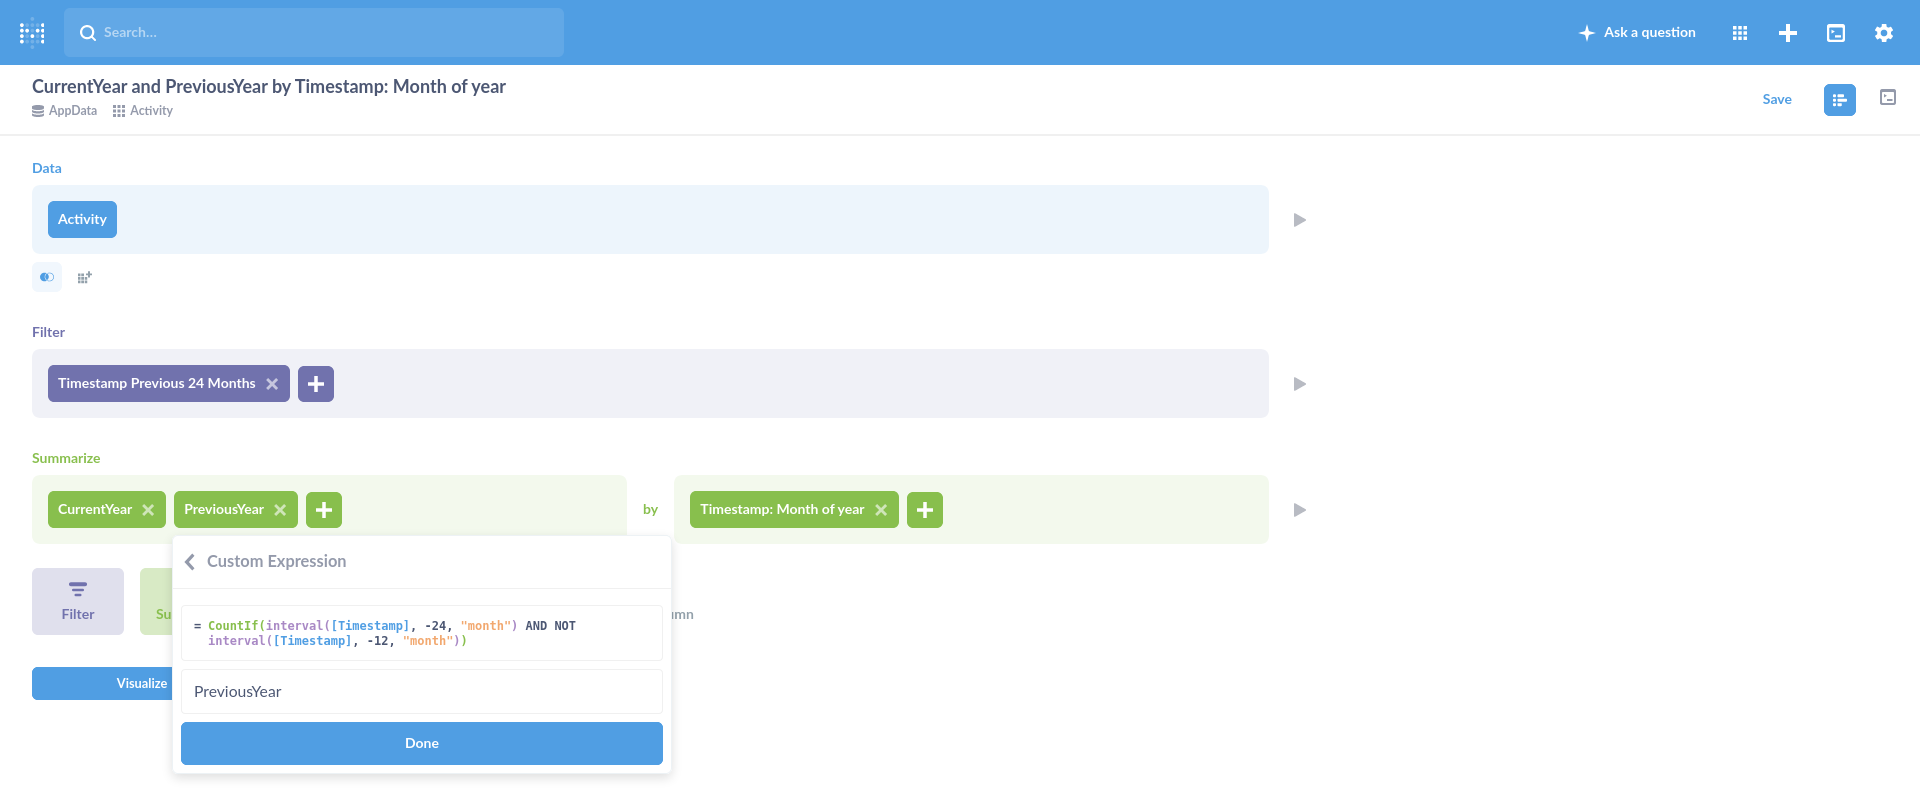
I have already read the excellent article on time series comparisons and I've even taken it a step further by using the interval() function / custom expression to allow for a more dynamic approach rather than hardcoding dates, as follows:

- where Current Year is defined as
CountIf(interval([Sign Up Date], 0, "year")); - and Previous Year is defined as
CountIf(interval([Sign Up Date], -1, "year") AND NOT interval([Sign Up Date], 0, "year"))
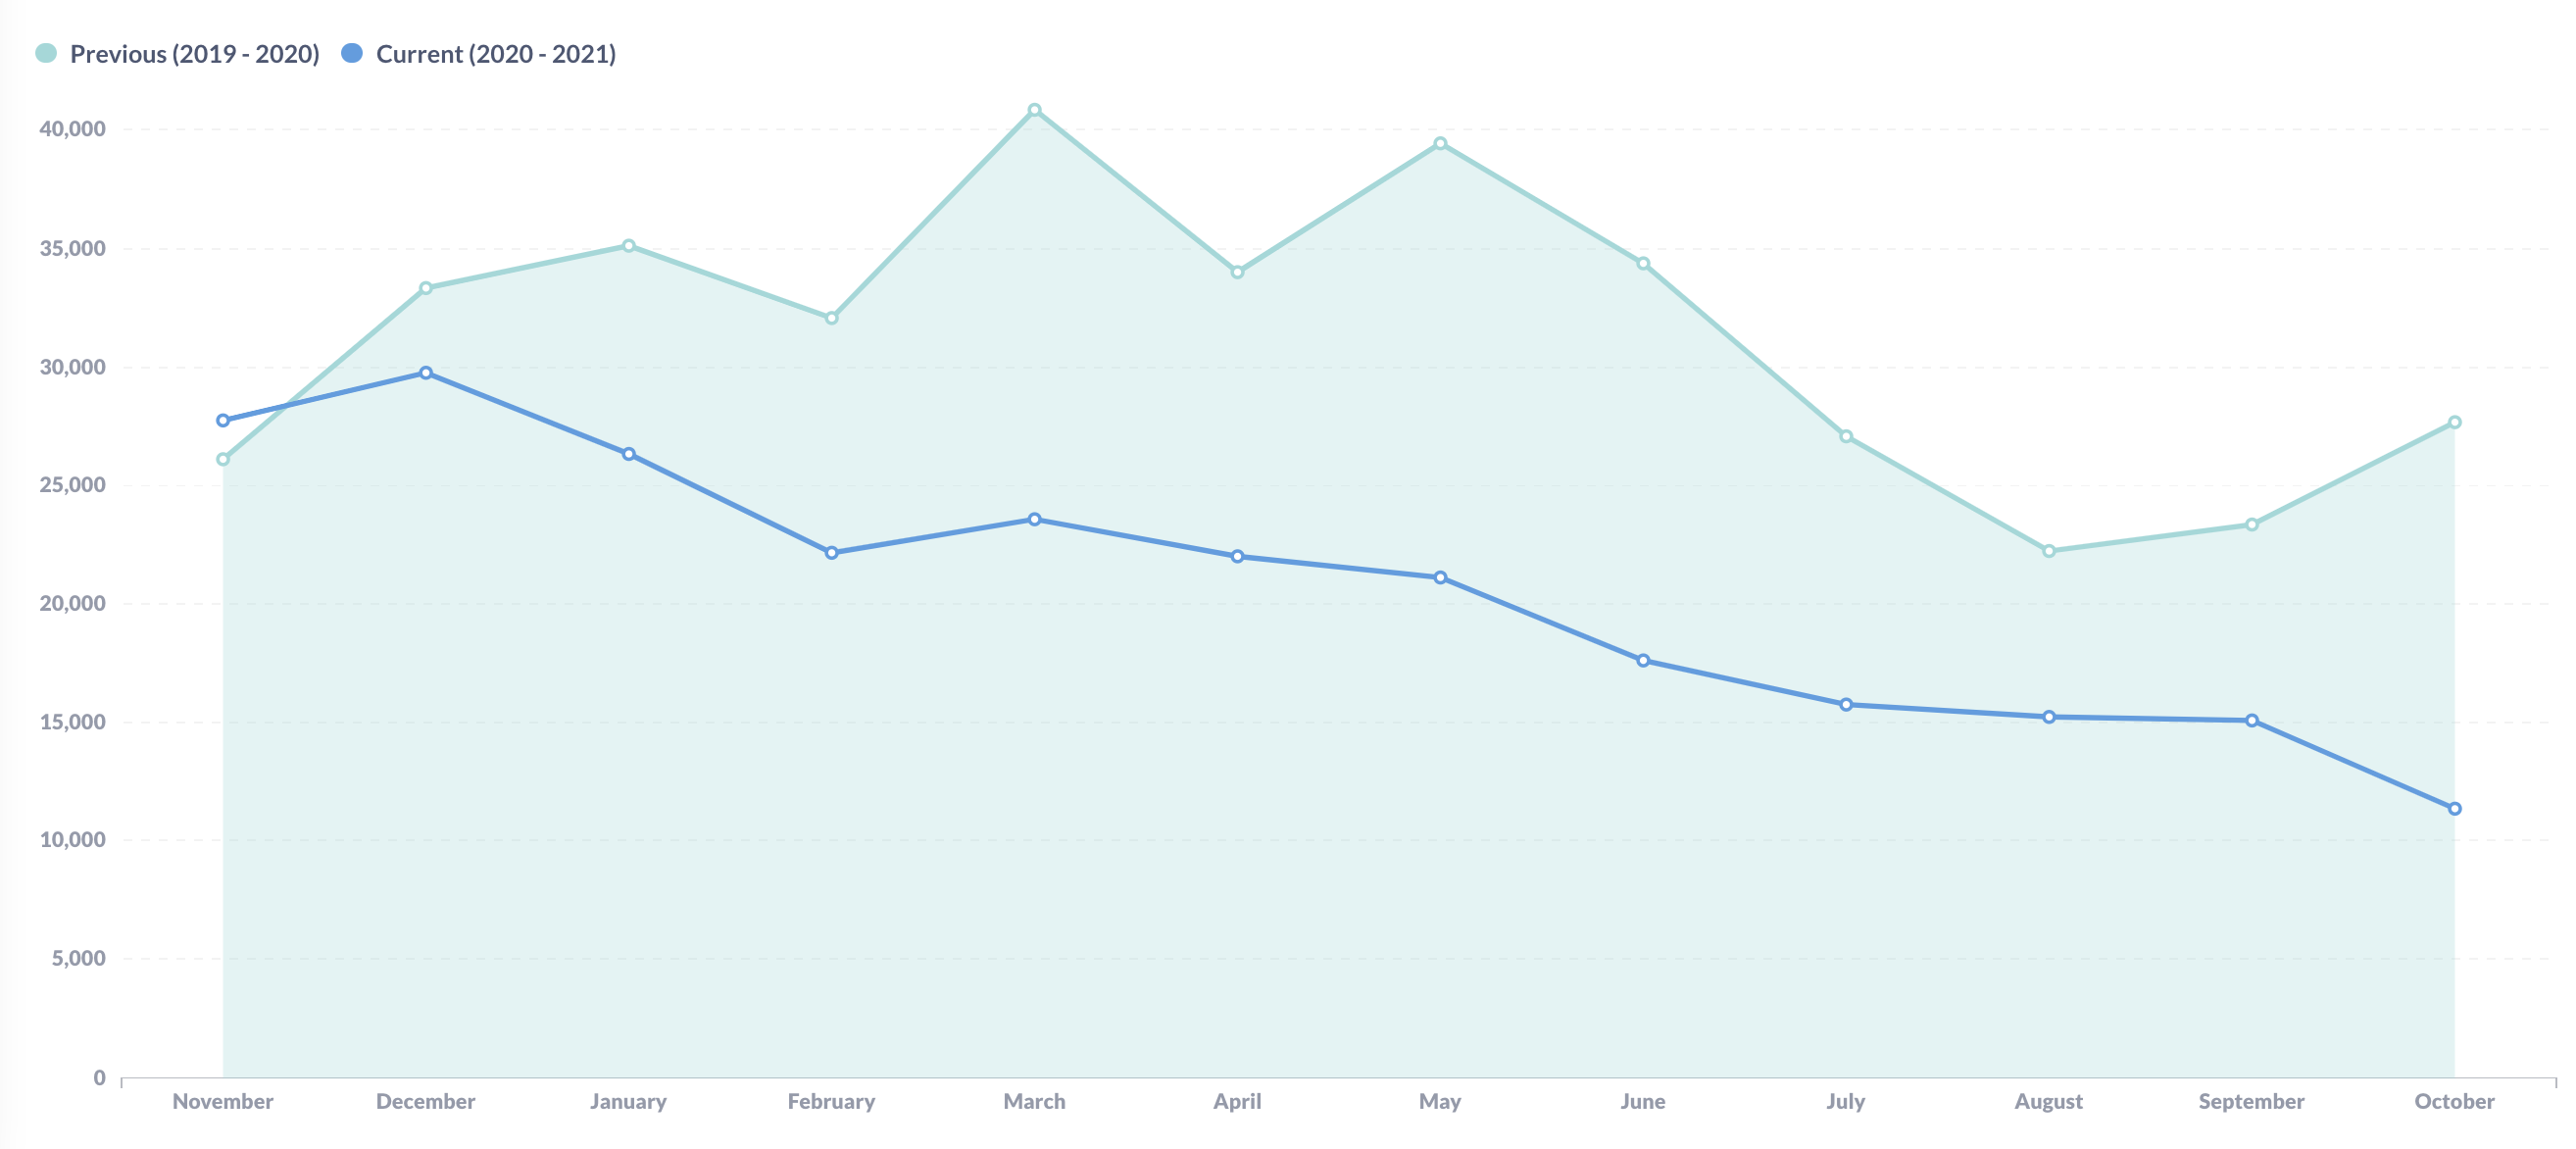
which yields the following:
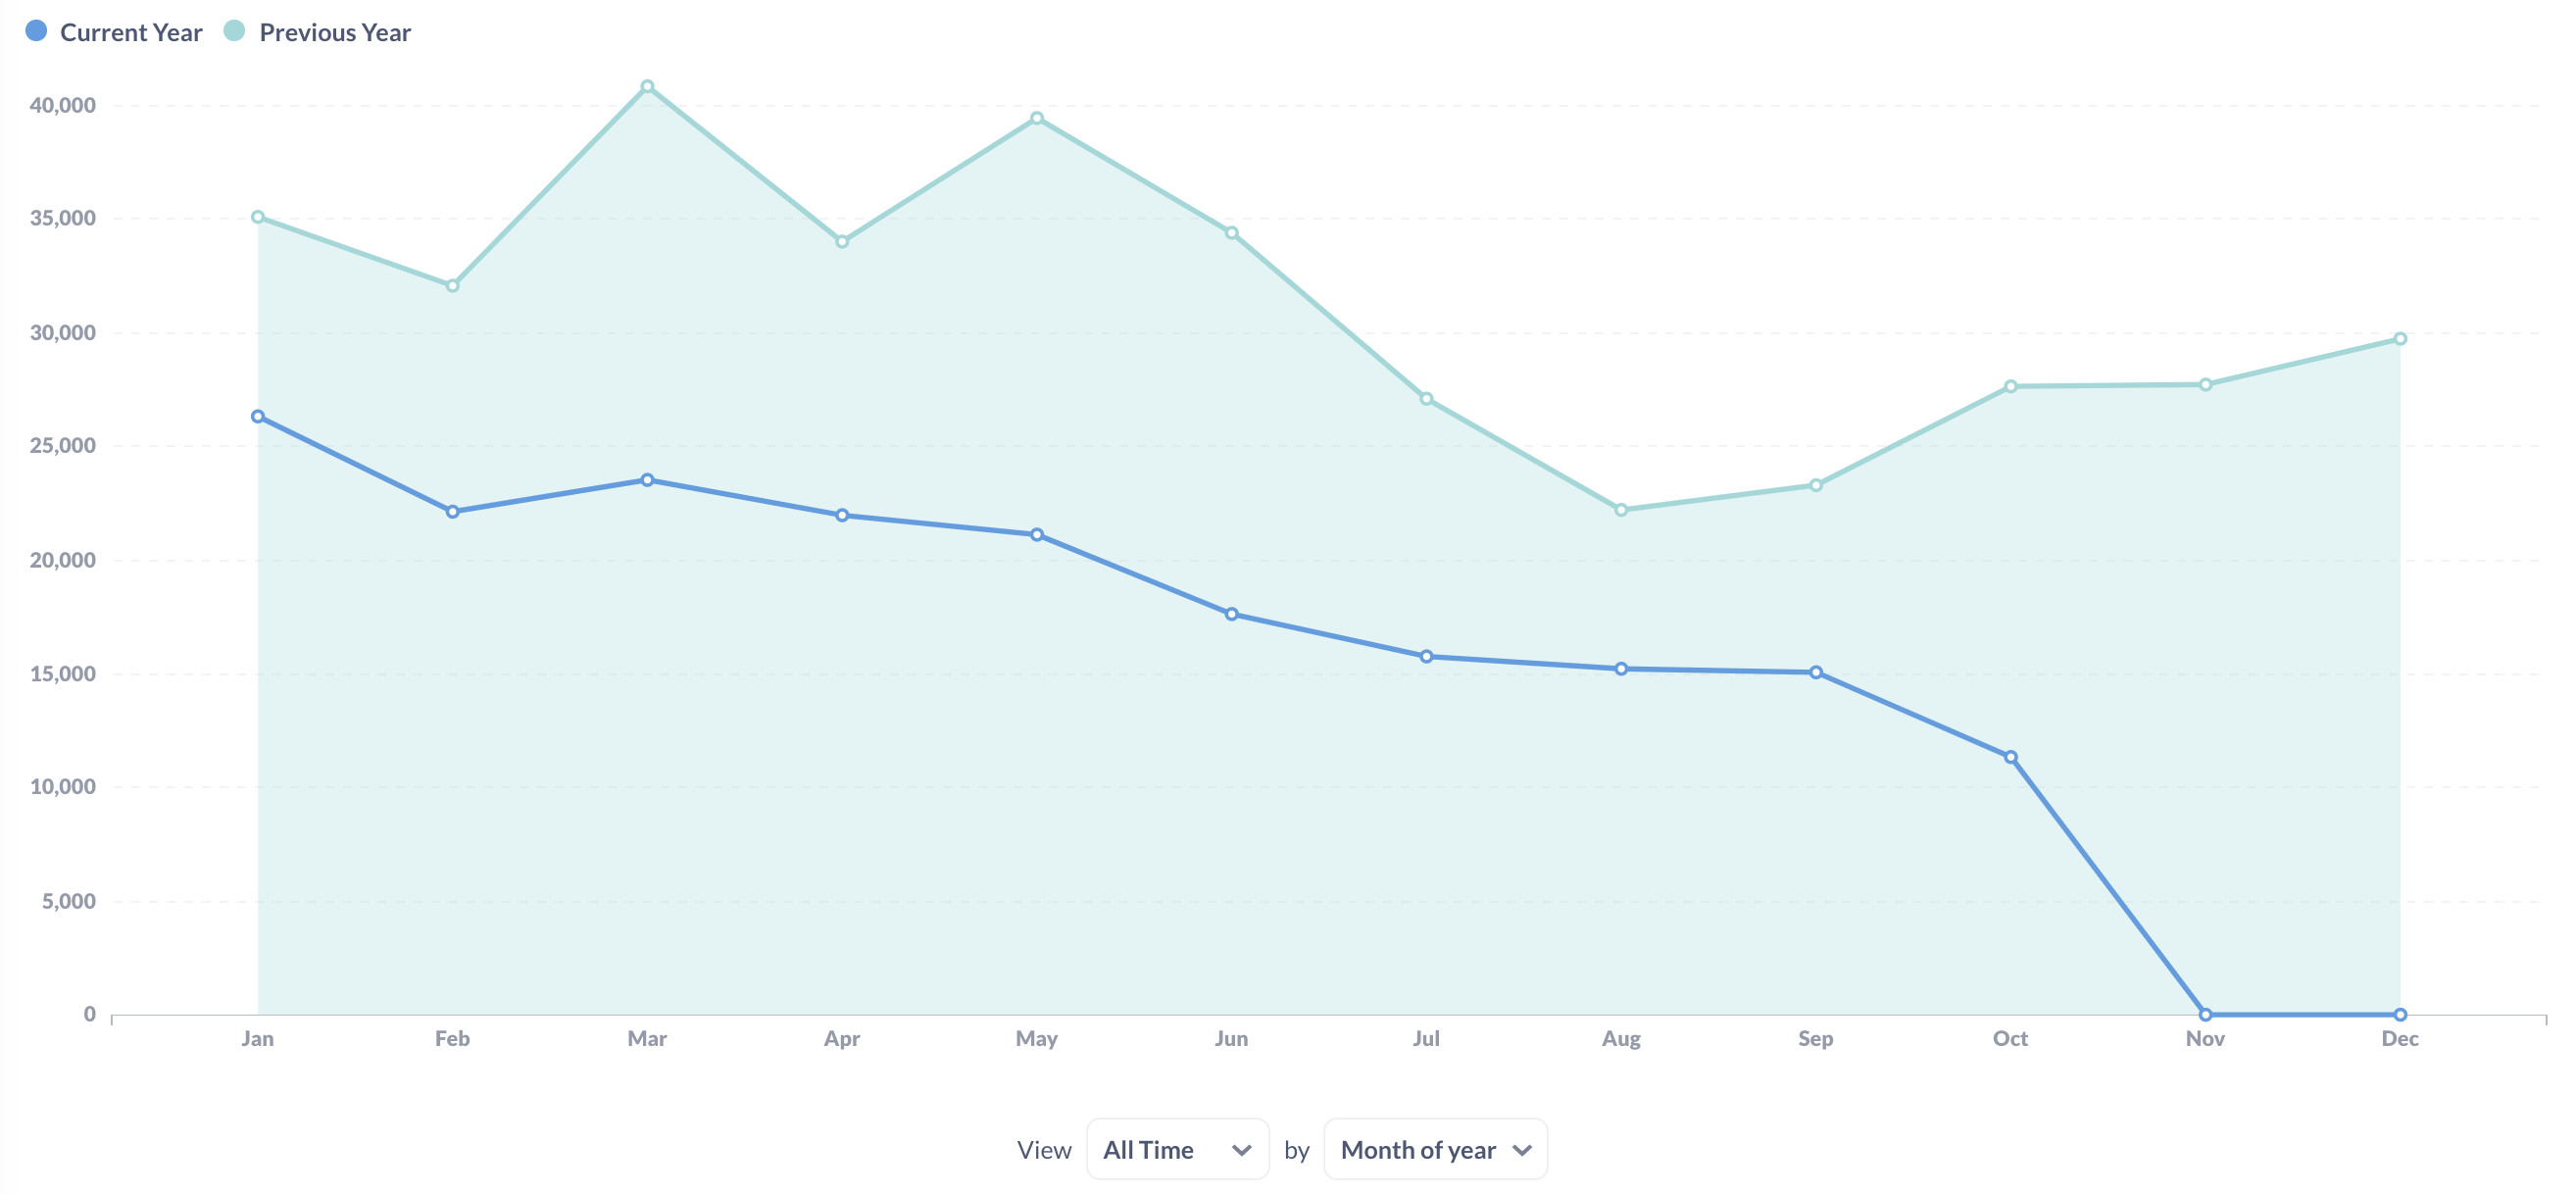
the same also works for 2 years (or N whatever ago):
CountIf(interval([Sign Up Date], -2, "year") AND NOT interval([Sign Up Date], -1, "year"))
Awesome!
However, here is where my issues / question begin:
- I was able to trim off the data for the months of November in December and end the x-axis at October (the current month), by adding a filter in the notebook editor AFTER the summarization to be
Current Year is greater than 0, which did the trick (yay!), but after doing this (because I don't like that it just shows a flat line at zero for the rest of the unfinished year), I lose the graphical ability to filter / group the time series (as was available previously).
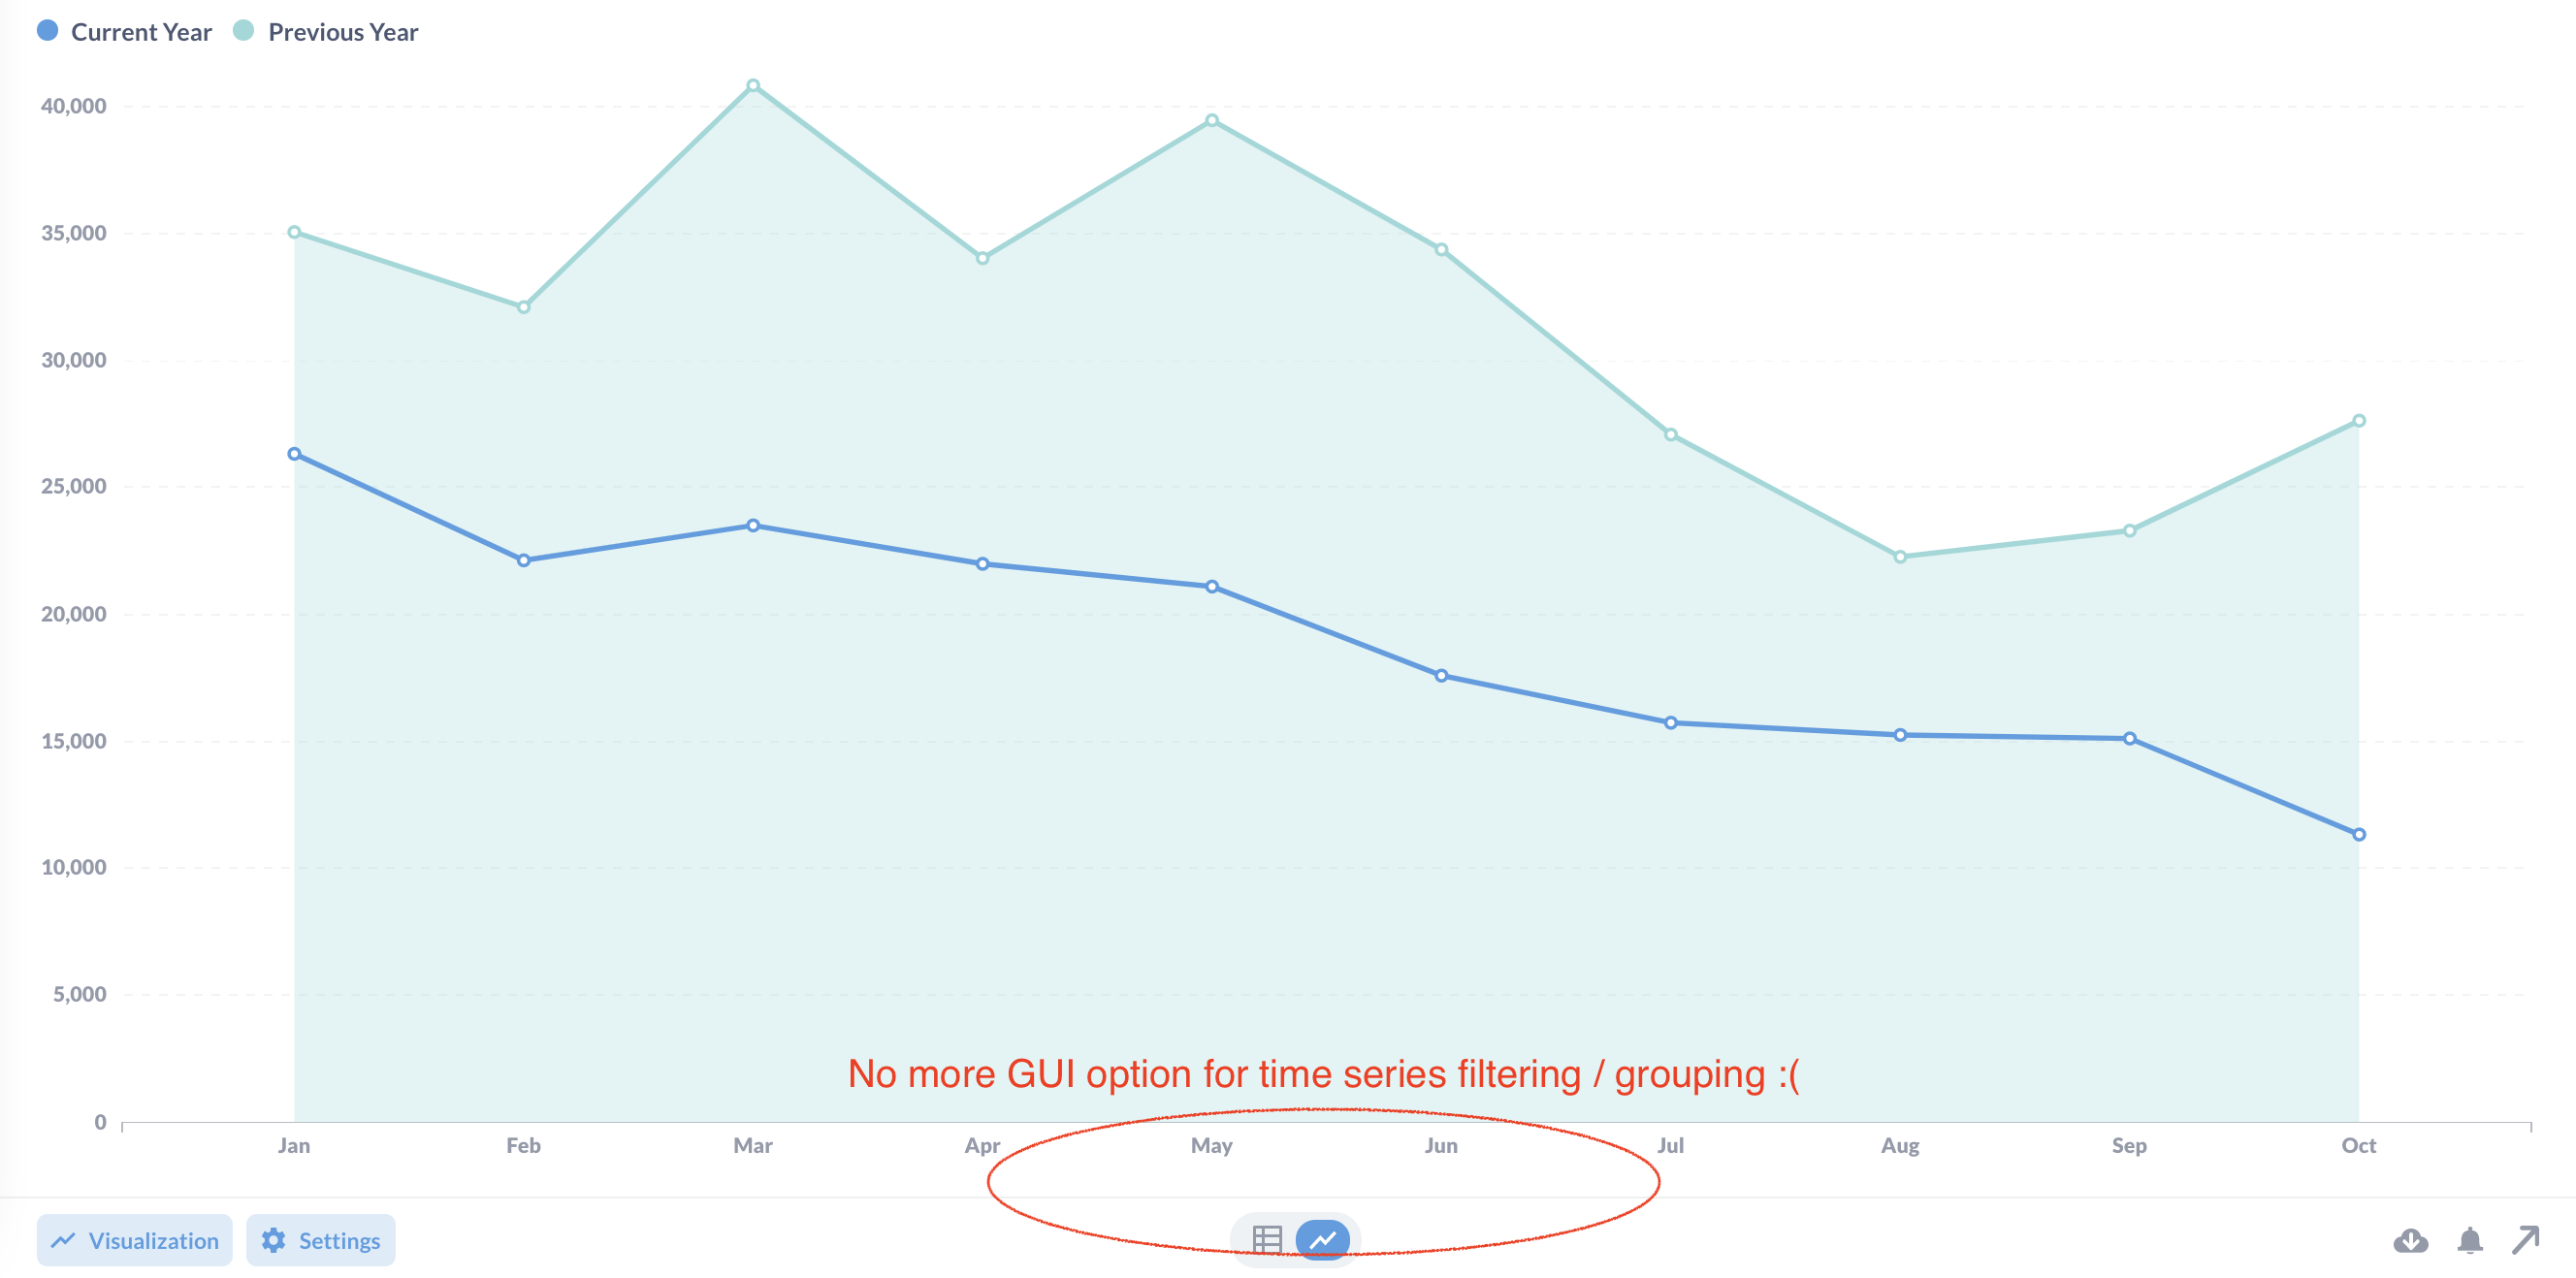
Do you know of a workaround for this? I suppose I would be fine with simply cutting off the current series after the current month (i.e. the line stops), rather than just dropping to zero (which on first glance looks like a bug/error).
- I suppose the bigger question, though, is would it be possible to always have the x-axis show a moving window for the past 12 months, rather than always starting at January? This would be more in line with the original screenshot in this post, where you always can see the data offset a year ago, regardless of the current month. This is especially important if it happens to be January or some other early month of the year. I am able to do this in SQL to achieve the desired result (see below), but I can't think of a way to do this with the custom expressions available to me in the notebook editor.
Is this something that can cobbled together with the graphical notebook editor, without the need for SQL, even if it's some "hacky" solution with Metabase's custom expressions? Or is this something that is simply not possible until a time comparison feature becomes available as an option in the notebook editor?
Thank you!