Hello everyone.
I’ve been practicing with metabase and I’ve been liking this so much.
So, I am trying to build a pie chart by sql consult, I could do this but I have some isues. My chart is going to show the number os players by day, but I am still having a issue that I don’t know how to solve.
My sql consult is following:
SELECT count(DISTINCT player_id) FROM matchmaking_stats_summary WHERE updated_at between '2020-02-01 00:00:00' and '2020-02-01 23:59:59' union
SELECT count(DISTINCT player_id) FROM matchmaking_stats_summary WHERE updated_at between '2020-02-02 00:00:00' and '2020-02-02 23:59:59' union
SELECT count(DISTINCT player_id) FROM matchmaking_stats_summary WHERE updated_at between '2020-02-03 00:00:00' and '2020-02-03 23:59:59' union
SELECT count(DISTINCT player_id) FROM matchmaking_stats_summary WHERE updated_at between '2020-02-04 00:00:00' and '2020-02-04 23:59:59' union
SELECT count(DISTINCT player_id) FROM matchmaking_stats_summary WHERE updated_at between '2020-02-05 00:00:00' and '2020-02-05 23:59:59'
a beautiful chart is returned to me where I can set the config to show the data in percentage, it is amazing. But I don’t know how to show this in an ascending order (I belive I can fix this with a better sql consult); and I would like to show the date day in the label instead of “count(DISTINCT player_id)”. I don’t know if this is a free account limitation.
Here is a example of a pie chart:
https://mail.pursuittechnology.co.uk:8443/public/dashboard/569bf696-4faa-4ac8-a294-084529916cf9
Thank you everyone, have a nice day.
Hi @vsantos
I don’t know which database you’re querying, so don’t know which function you have available - do some lookup yourself - but something like this should work:
SELECT * FROM (
SELECT date_format(updated_at, '%Y-%m-%d') AS d, count(DISTINCT player_id) AS c FROM matchmaking_stats_summary WHERE updated_at between '2020-02-01 00:00:00' and '2020-02-01 23:59:59' union
SELECT date_format(updated_at, '%Y-%m-%d') AS d, count(DISTINCT player_id) AS c FROM matchmaking_stats_summary WHERE updated_at between '2020-02-02 00:00:00' and '2020-02-02 23:59:59' union
SELECT date_format(updated_at, '%Y-%m-%d') AS d, count(DISTINCT player_id) AS c FROM matchmaking_stats_summary WHERE updated_at between '2020-02-03 00:00:00' and '2020-02-03 23:59:59' union
SELECT date_format(updated_at, '%Y-%m-%d') AS d, count(DISTINCT player_id) AS c FROM matchmaking_stats_summary WHERE updated_at between '2020-02-04 00:00:00' and '2020-02-04 23:59:59' union
SELECT date_format(updated_at, '%Y-%m-%d') AS d, count(DISTINCT player_id) AS c FROM matchmaking_stats_summary WHERE updated_at between '2020-02-05 00:00:00' and '2020-02-05 23:59:59'
) AS x
ORDER BY c ASC
There’s a lot more optimization that can be done to your query, but I don’t know what you’re trying to do, so you’ll have to figure that out yourself - stackoverflow.com has a great community for getting help with regular SQL for many databases
I found something like this(in the sense of sql), I am sorry for ask this here.
The metabase question is about how to set x and y label in pie chart. I am searching in the documentation.
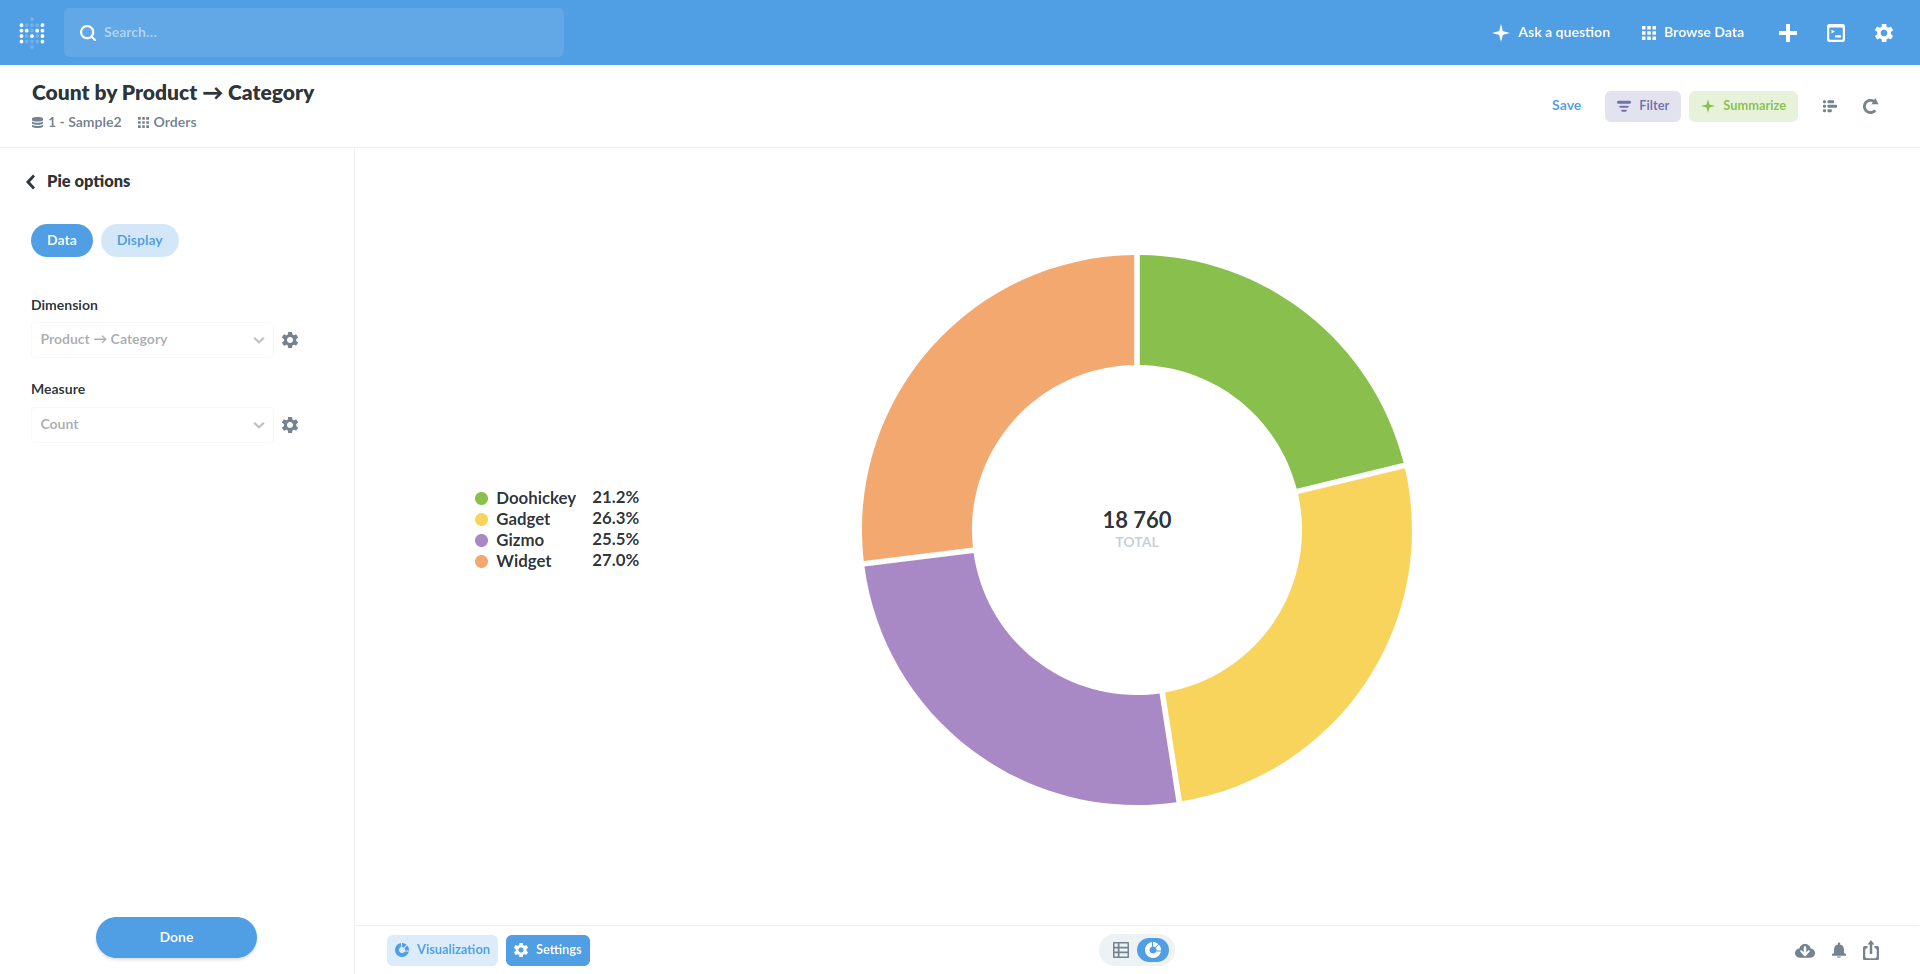
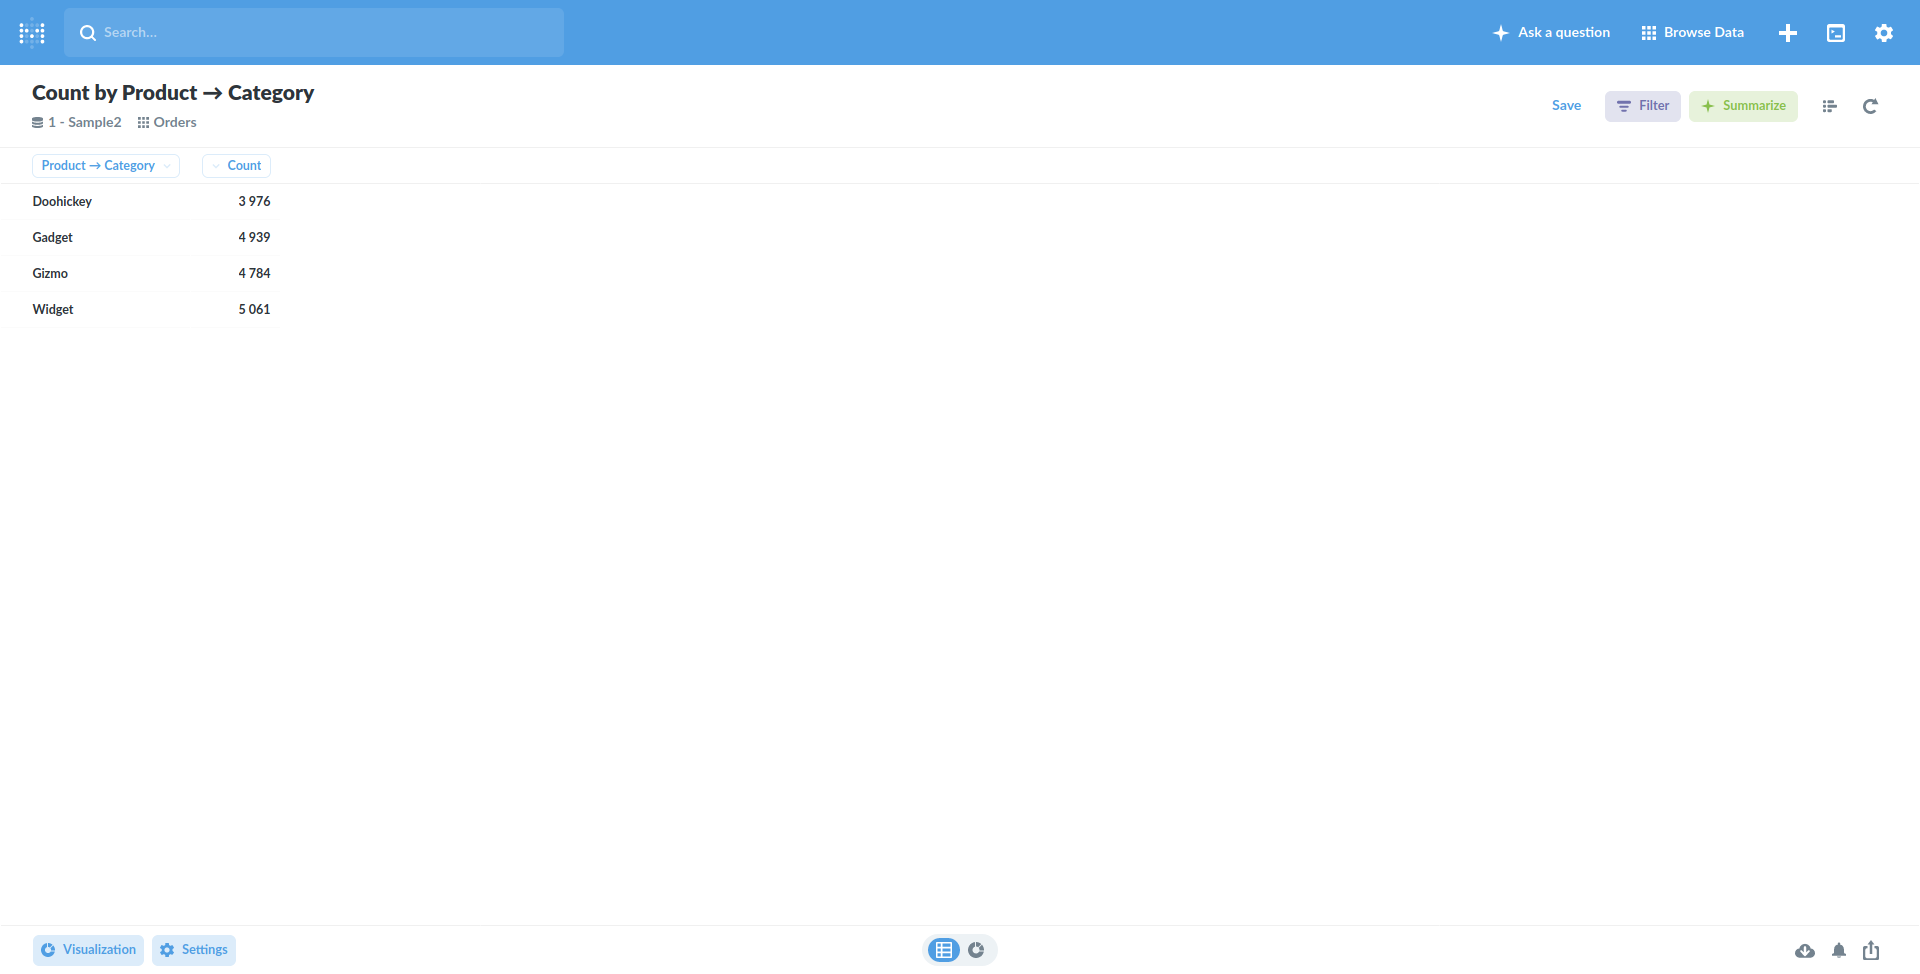
@vsantos You need two columns. One dimension, and one metric:
Thank you again, I understand why it was happening.
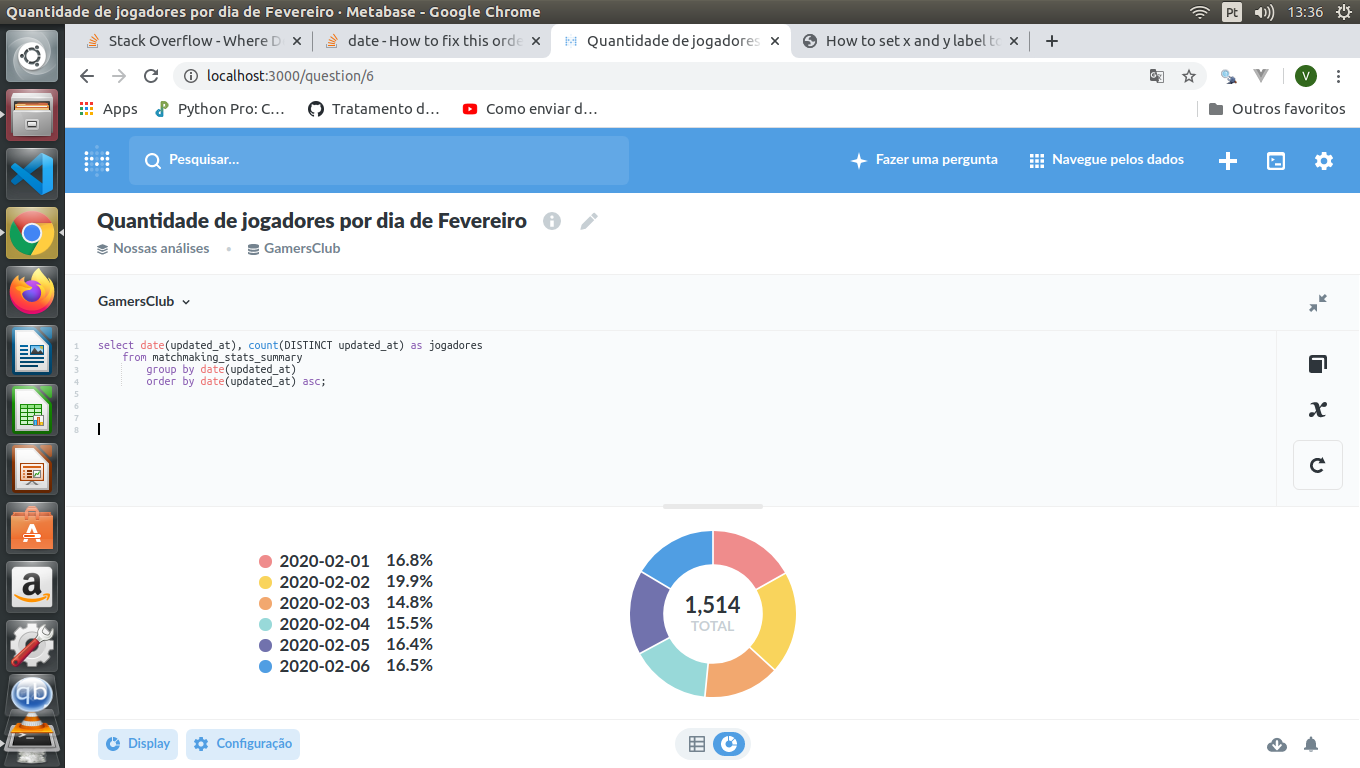
So, I take more atention to the way that I calling date time, and I can solve this in a simple sql query:
select date(updated_at), count(DISTINCT updated_at) as jogadores
	from matchmaking_stats_summary
		group by date(updated_at)
		order by date(updated_at) asc;
Thank you.
1 Like