Hi guys,
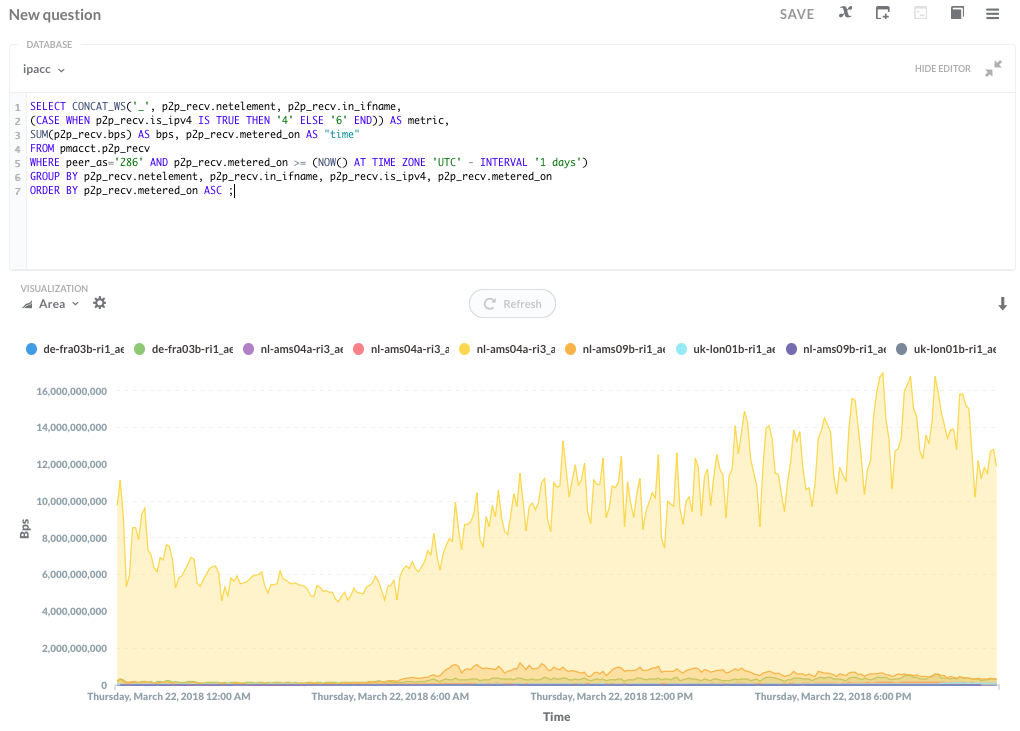
Would you be so kind to advise how I can achieve the following graph, for example

To be more specific,
the metric name is a concatenation of the columns peer_as, netelement in_ifname, is_ipv4
the value is the column bps
plotted over time metered_on
How can I achieve that in Metabase ?