When I load a dashboard with many questions CPU goes to 100% and is responding slowly
the console is filled with hundreds of errors.
My end users are complaining because this makes the user experience bad.
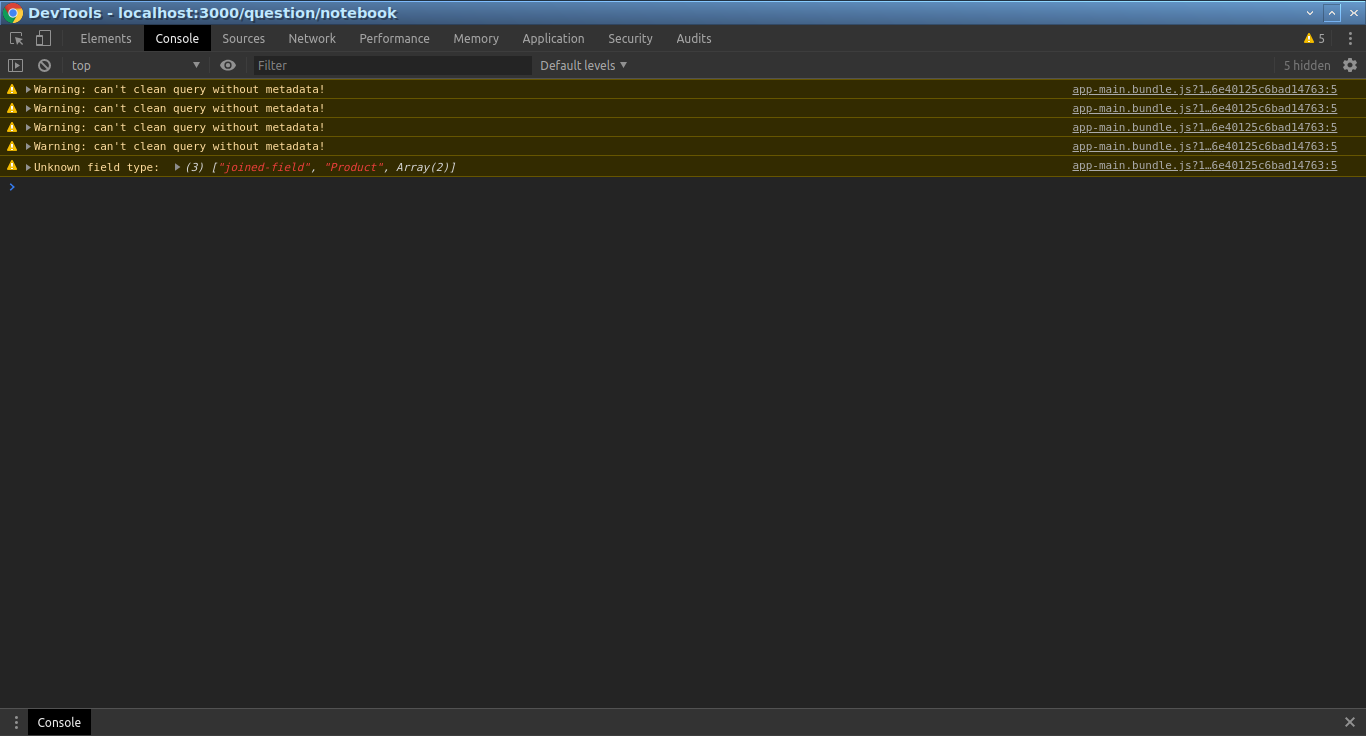
Here is a picture with the message on a simple question.
In my dashboard I have hundreds of unknown type warnings.
To reproduce:
- Create a question
- Use sample dataset
- Select a table
- Join another table
- Sum with something
- Do a group by to a name field of the joined table
I use:
- postgres 9.6
- metabase 0.35.3
- Chrome Version 81.0.4044.92 (Official Build) (64-bit)
- and Firefox 72.0.1 (64-bit)
{
"browser-info": {
"language": "en-US",
"platform": "Linux x86_64",
"userAgent": "Mozilla/5.0 (X11; Linux x86_64) AppleWebKit/537.36 (KHTML, like Gecko) Chrome/81.0.4044.92 Safari/537.36",
"vendor": "Google Inc."
},
"system-info": {
"file.encoding": "UTF-8",
"java.runtime.name": "OpenJDK Runtime Environment",
"java.runtime.version": "11.0.5+10",
"java.vendor": "AdoptOpenJDK",
"java.vendor.url": "https://adoptopenjdk.net/",
"java.version": "11.0.5",
"java.vm.name": "OpenJDK 64-Bit Server VM",
"java.vm.version": "11.0.5+10",
"os.name": "Linux",
"os.version": "4.4.0-154-generic",
"user.language": "en",
"user.timezone": "GMT"
},
"metabase-info": {
"databases": [
"postgres",
"h2"
],
"hosting-env": "unknown",
"application-database": "postgres",
"application-database-details": {
"database": {
"name": "PostgreSQL",
"version": "9.6.17"
},
"jdbc-driver": {
"name": "PostgreSQL JDBC Driver",
"version": "42.2.8"
}
},
"run-mode": "prod",
"version": {
"date": "2020-04-21",
"tag": "v0.35.3",
"branch": "release-0.35.x",
"hash": "1d424cb"
},
"settings": {
"report-timezone": null
}
}
}
Log
[e768d466-20b9-4b22-9df6-bdd5ab6c2073] 2020-04-23T11:04:25+03:00 DEBUG metabase.middleware.log GET /api/table/2/query_metadata 200 21.9 ms (11 DB calls) App DB connections: 0/15 Jetty threads: 3/50 (4 idle, 0 queued) (108 total active threads) Queries in flight: 0 (0 queued)
[e768d466-20b9-4b22-9df6-bdd5ab6c2073] 2020-04-23T11:04:25+03:00 DEBUG metabase.middleware.log GET /api/table/1/query_metadata 200 12.5 ms (8 DB calls) App DB connections: 0/15 Jetty threads: 3/50 (4 idle, 0 queued) (108 total active threads) Queries in flight: 0 (0 queued)
[e768d466-20b9-4b22-9df6-bdd5ab6c2073] 2020-04-23T11:04:25+03:00 DEBUG metabase.middleware.log GET /api/table/3/query_metadata 200 10.5 ms (8 DB calls) App DB connections: 0/15 Jetty threads: 3/50 (3 idle, 0 queued) (108 total active threads) Queries in flight: 0 (0 queued)