Hello!
I'm having a problem with visualization data from my table. I expect to be able to use a field with a datatype as an x-axis or y-axis argument.
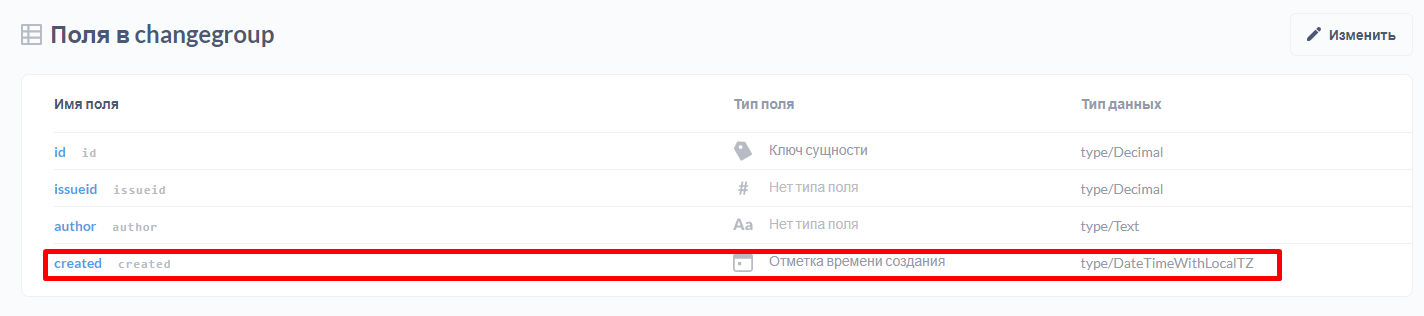
For example, in the screenshots below, you can see a table with a "created" column with the type "DateTimeWithLocalTZ".
Are there any ways to use the information from the "created" column as an argument X or Y for using the visualization capabilities?
flamber
February 17, 2022, 2:01pm
2
Hi @igorromanov
Post "Diagnostic Info" from Admin > Troubleshooting.
You have to have a numeric column to display the values on that in the Y-axis of charts.
Hi @flamber !
If I understand you correctly, there is no way for Metabase to create a visualization if numeric data will not used as the X-axis or Y-axis?
flamber
February 21, 2022, 9:06am
4
@igorromanov You can use strings for X-axis, but not the Y-axis. You have to convert your data, so it returns something that is numeric.