Hi!
I have a table in Metabase
I would like to turn it into a table where each row is a line, similar to the one below
is this possible?
Hi!
I have a table in Metabase
I would like to turn it into a table where each row is a line, similar to the one below
is this possible?
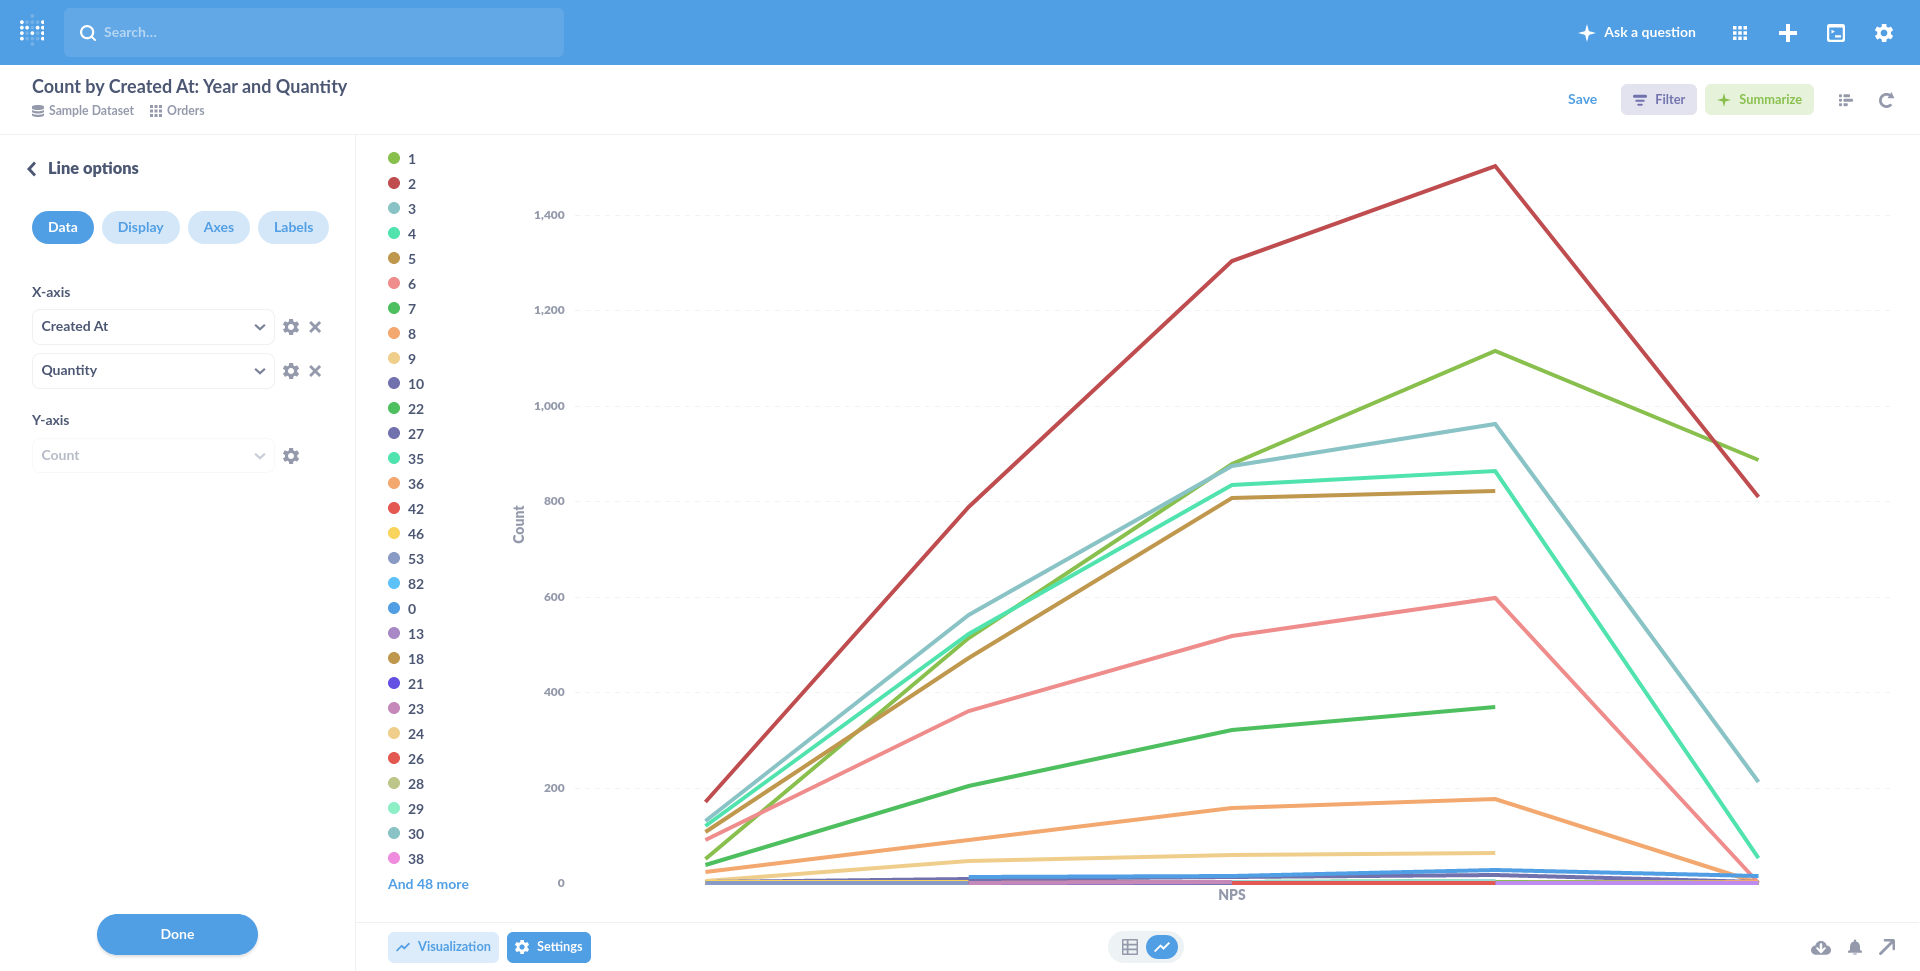
Hi @brunolucas
It looks like you are linking to a pivoted table. It's slightly difficult to understand your data, but you would use two fields in the X-axis, so there's a breakout - example:
Redirecting…
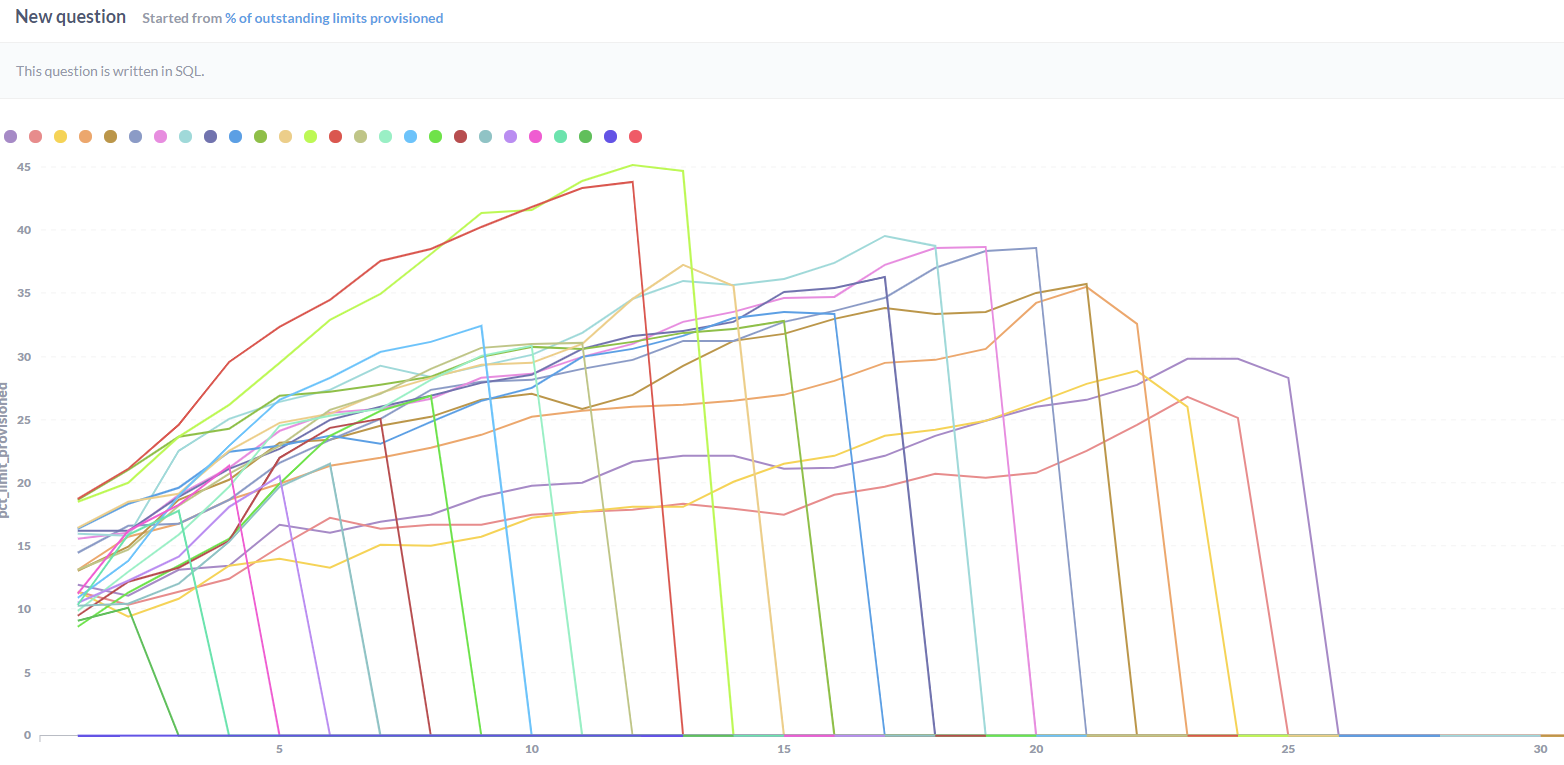
Amazing @flamber this works super!
additional question: I have zero values plotted. Is there any way I can have the graph interpret 0 as missing and simply not plot?
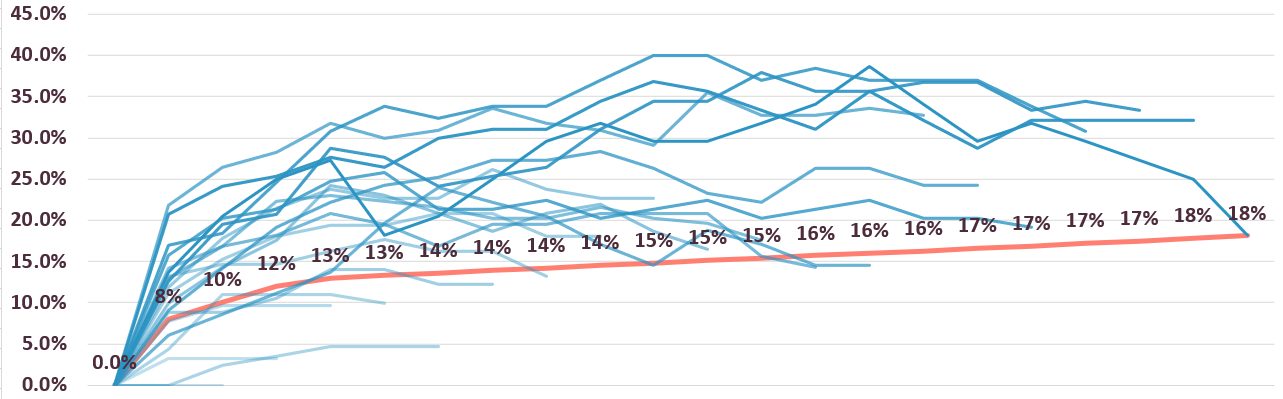
@brunolucas Return null instead of 0.