bwdm
March 19, 2021, 1:32am
1
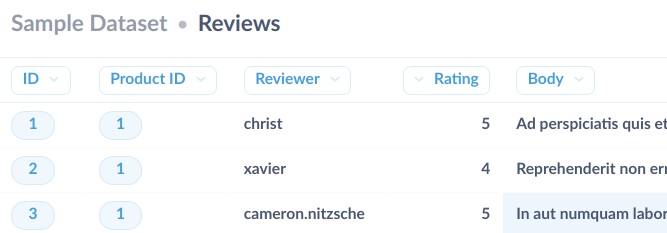
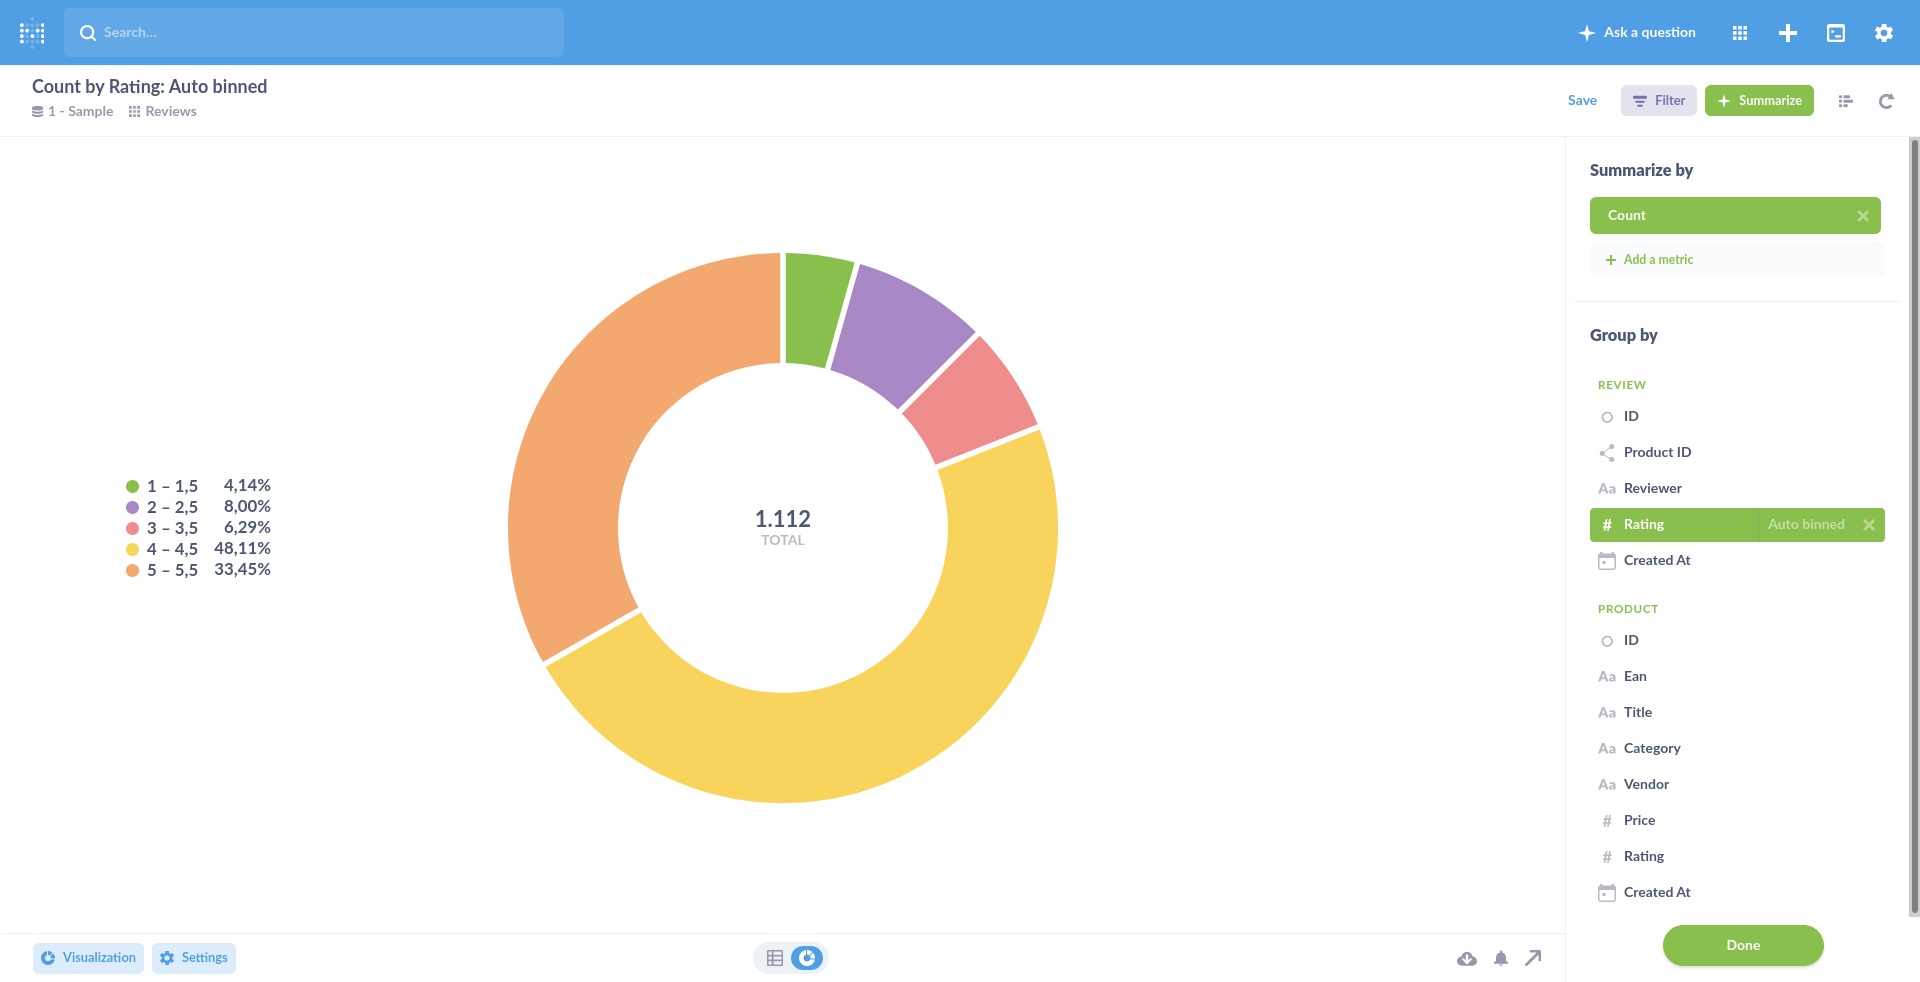
I'm trying to make a simple pie chart on version 0.38.2 (jar) with the sample data of reviews, where each rating ranges from 1 to 5 as follows.
But apparently I can't visualize the proportions of ratings no matter what I select on the pie chart options. Everything is always accounted as other.
Hi @bwdm
bwdm
March 19, 2021, 4:09pm
3
Oh, I see. Thank you.
By the way, how can I make joins with saved questions? When I click saved questions it is empty even though I have plenty of saved questions.
@bwdm There are some limitations: https://www.metabase.com/docs/latest/users-guide/custom-questions.html#picking-your-starting-data
Try doing a browser refresh - sometimes it’s a cache problem.
Please post “Diagnostic Info” from Admin > Troubleshooting, and the database you’re using.
Check the log for errors - Admin > Troubleshooting > Logs.
1 Like