kanishk
September 2, 2025, 11:27am
1
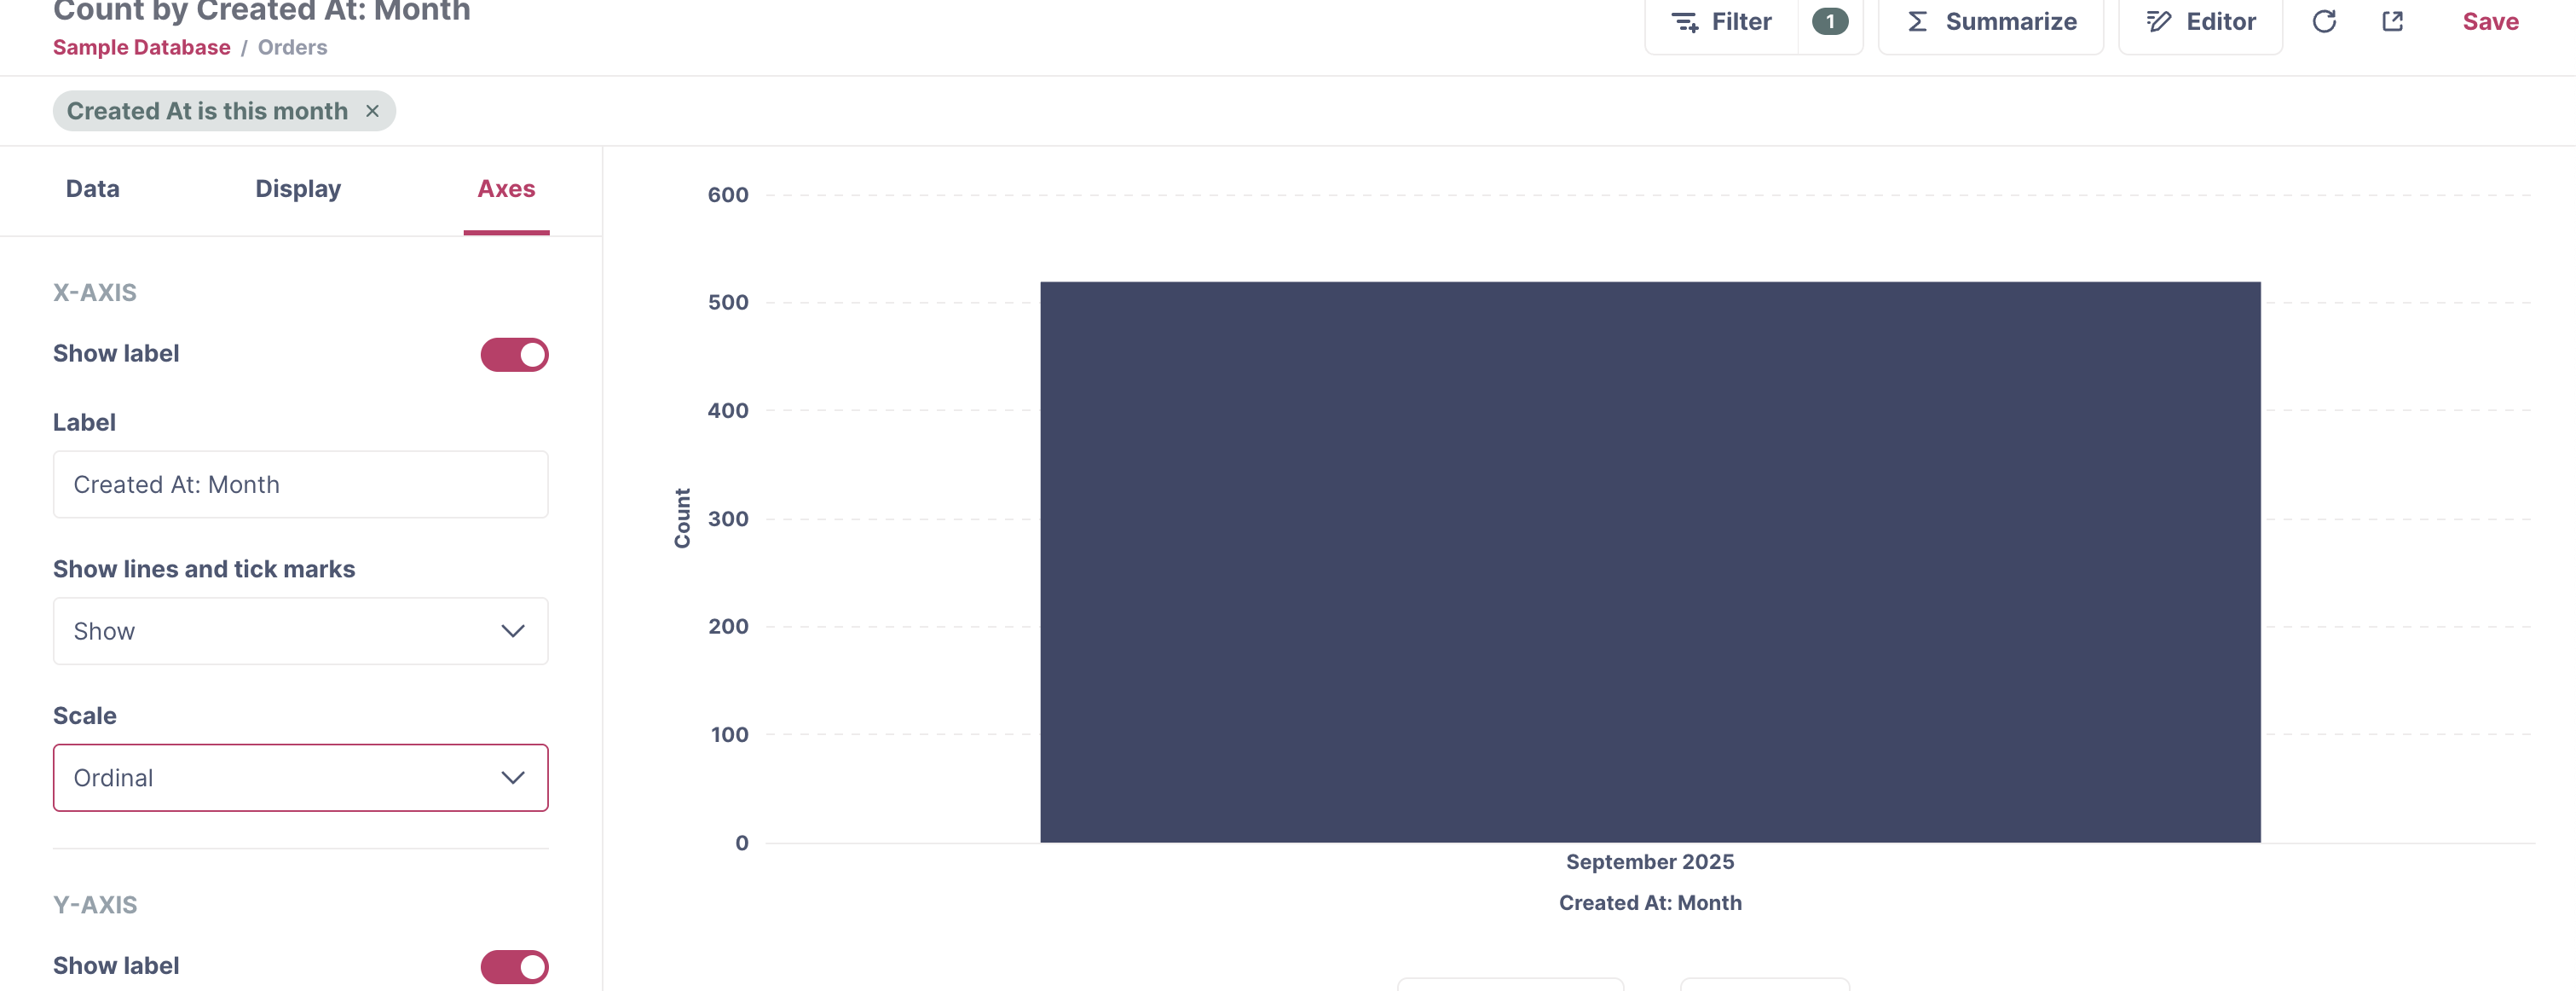
I have used time grouping to display the data by months, but when I filter for a specific date, the month changes to first day of the month.
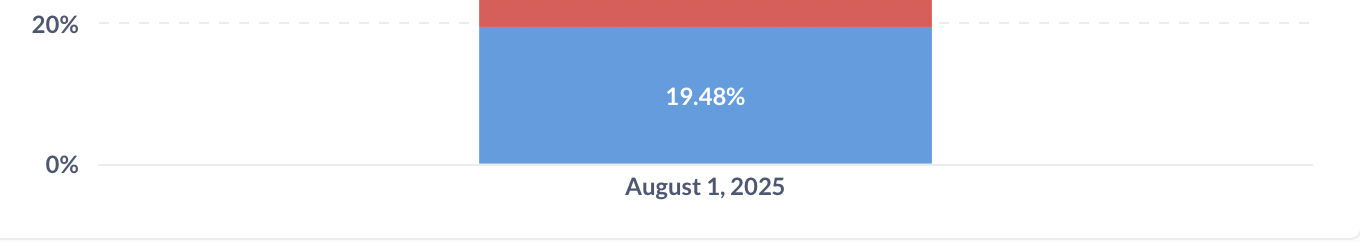
For eg when I filter for Aug 27 to Sept 2nd, the x-axis switches for Aug 2025 to August 1, 2025.
Is it possible to retain the month when filtering by date? (Scale is set to Timeseries already).
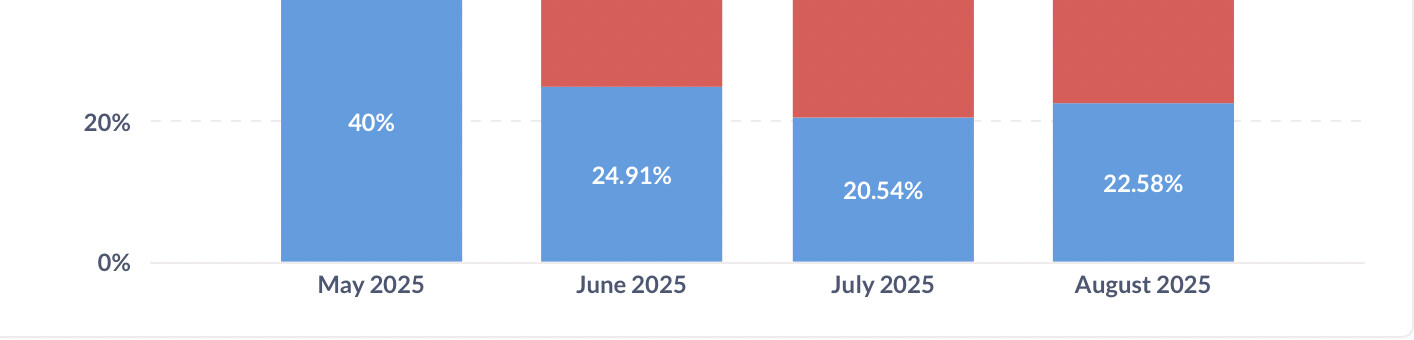
Without filter by date:
With date filter:
TonyC
September 4, 2025, 12:00pm
2
What version are you running?
kanishk
September 5, 2025, 5:51pm
3
I am using version 0.56.3
You have to Time group it by ‘month’ first, and apply a filter for a specific date within the same month. You will see the 1st of that month pop up in the chart, instead of the month itself.
TonyC
September 9, 2025, 1:31pm
4
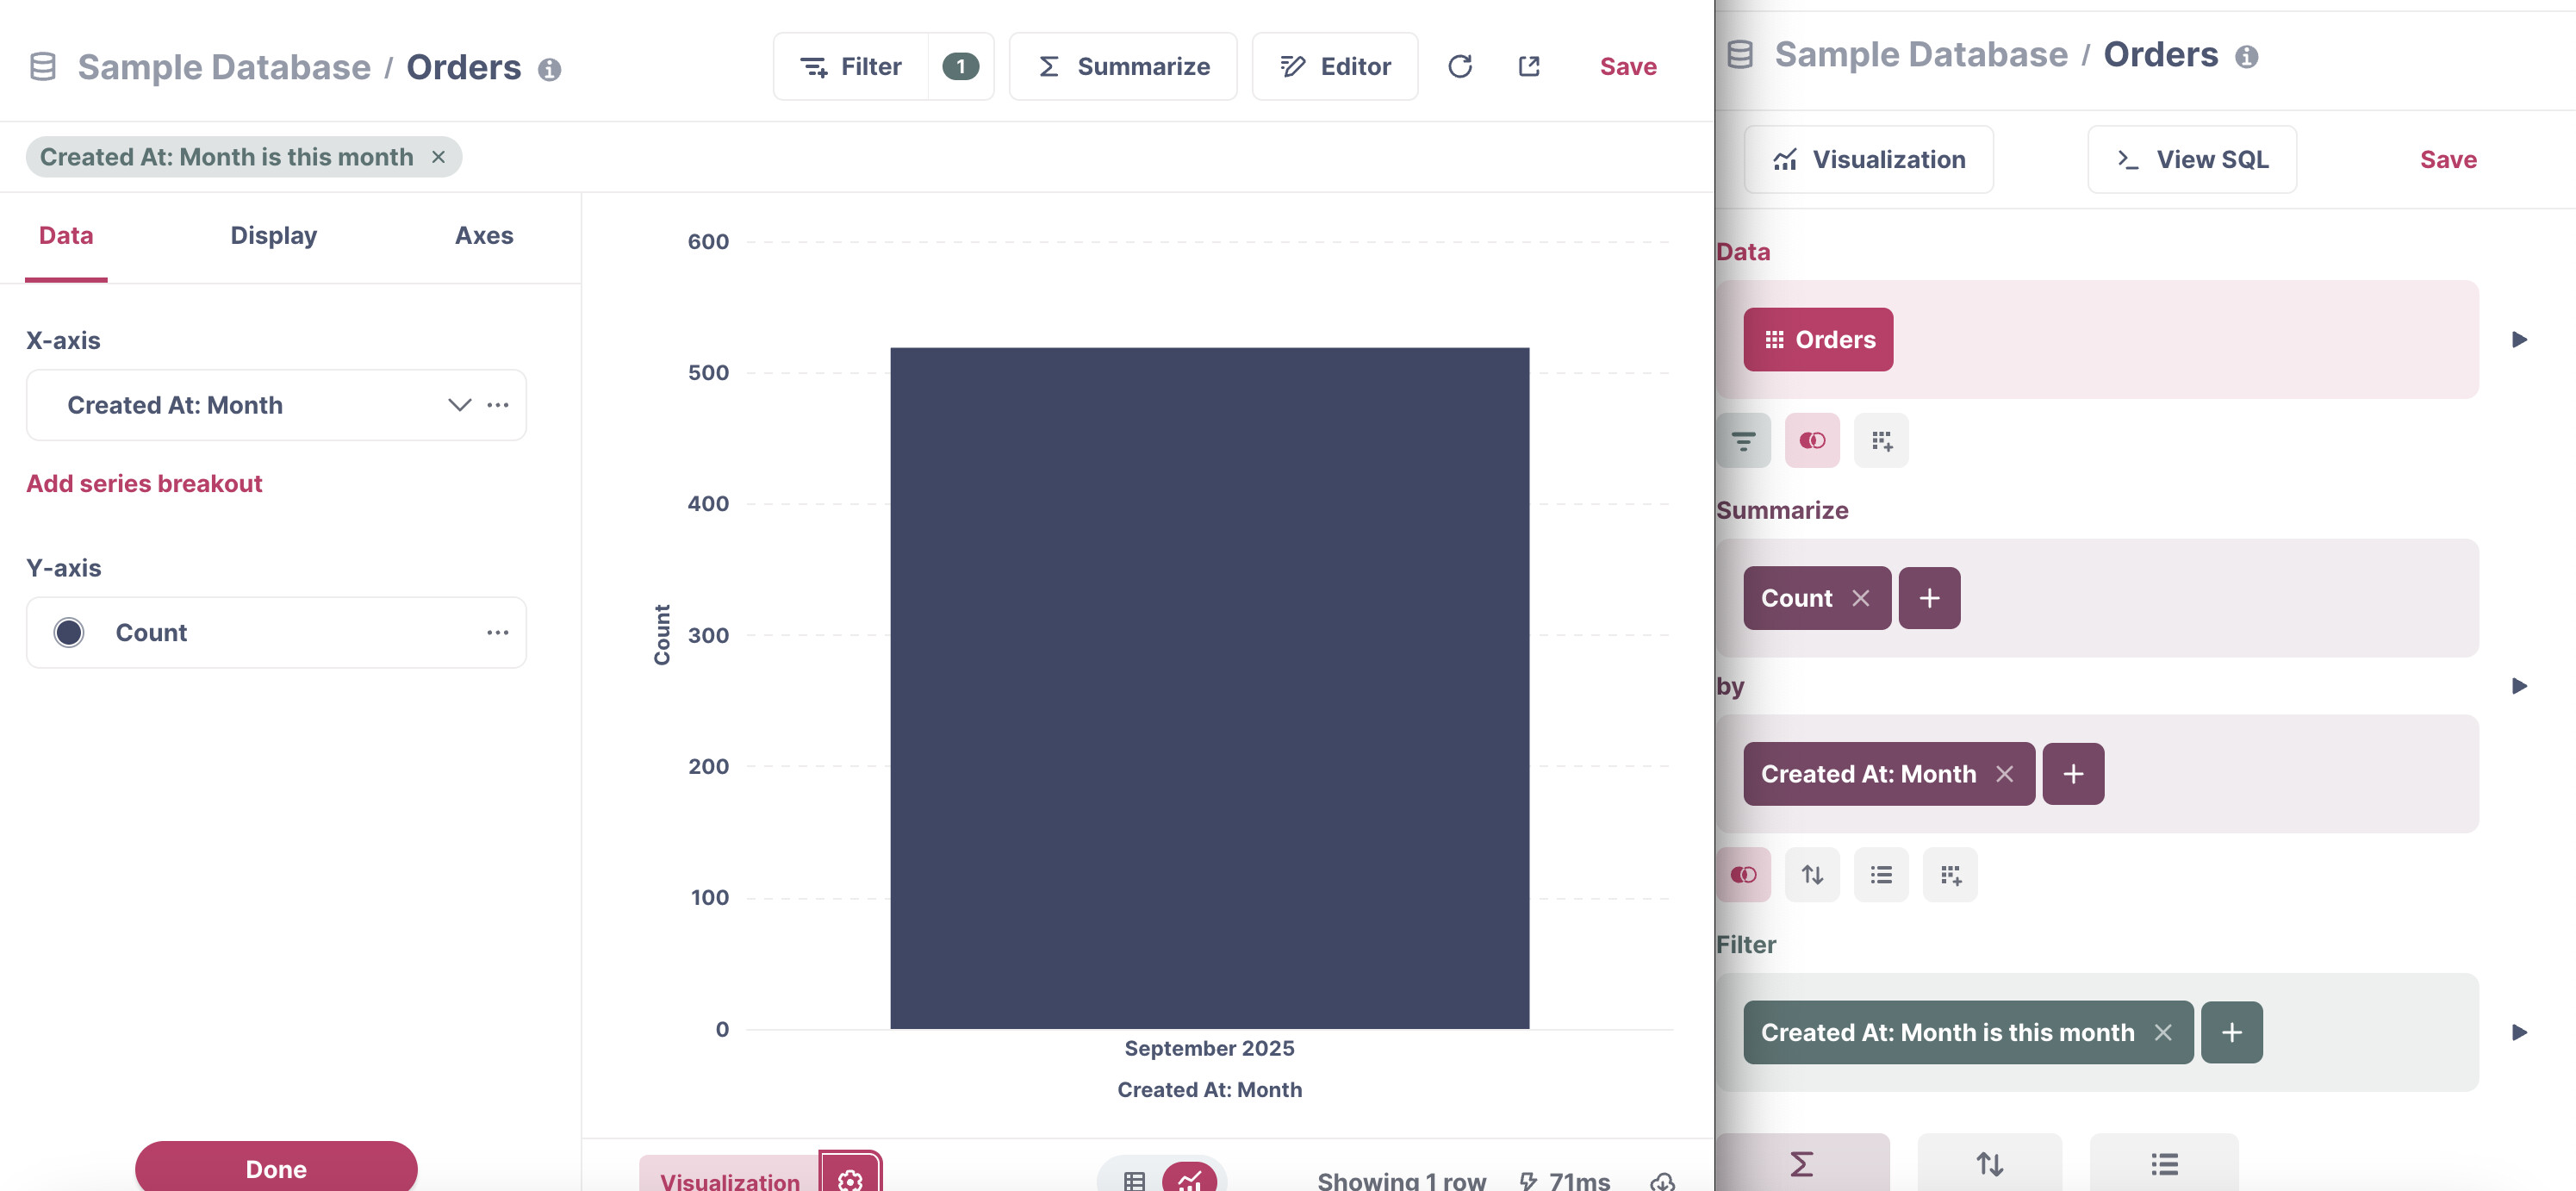
Like this? Can you share proper replication steps