I have two tables I'd like to join together:
- A list of users
- A table that has activity for users
I want to create a histogram of usage (number of weeks where there is actvity), but for the users where there isn't any usage I want rows that have a zero value.
I could easily do this in SQL like this:
select u.user_id, count(distinct a.week) as weeks
from users u
left join activity a on u.id = a.user_id and a.date >= '2020-01-01'
group by 1
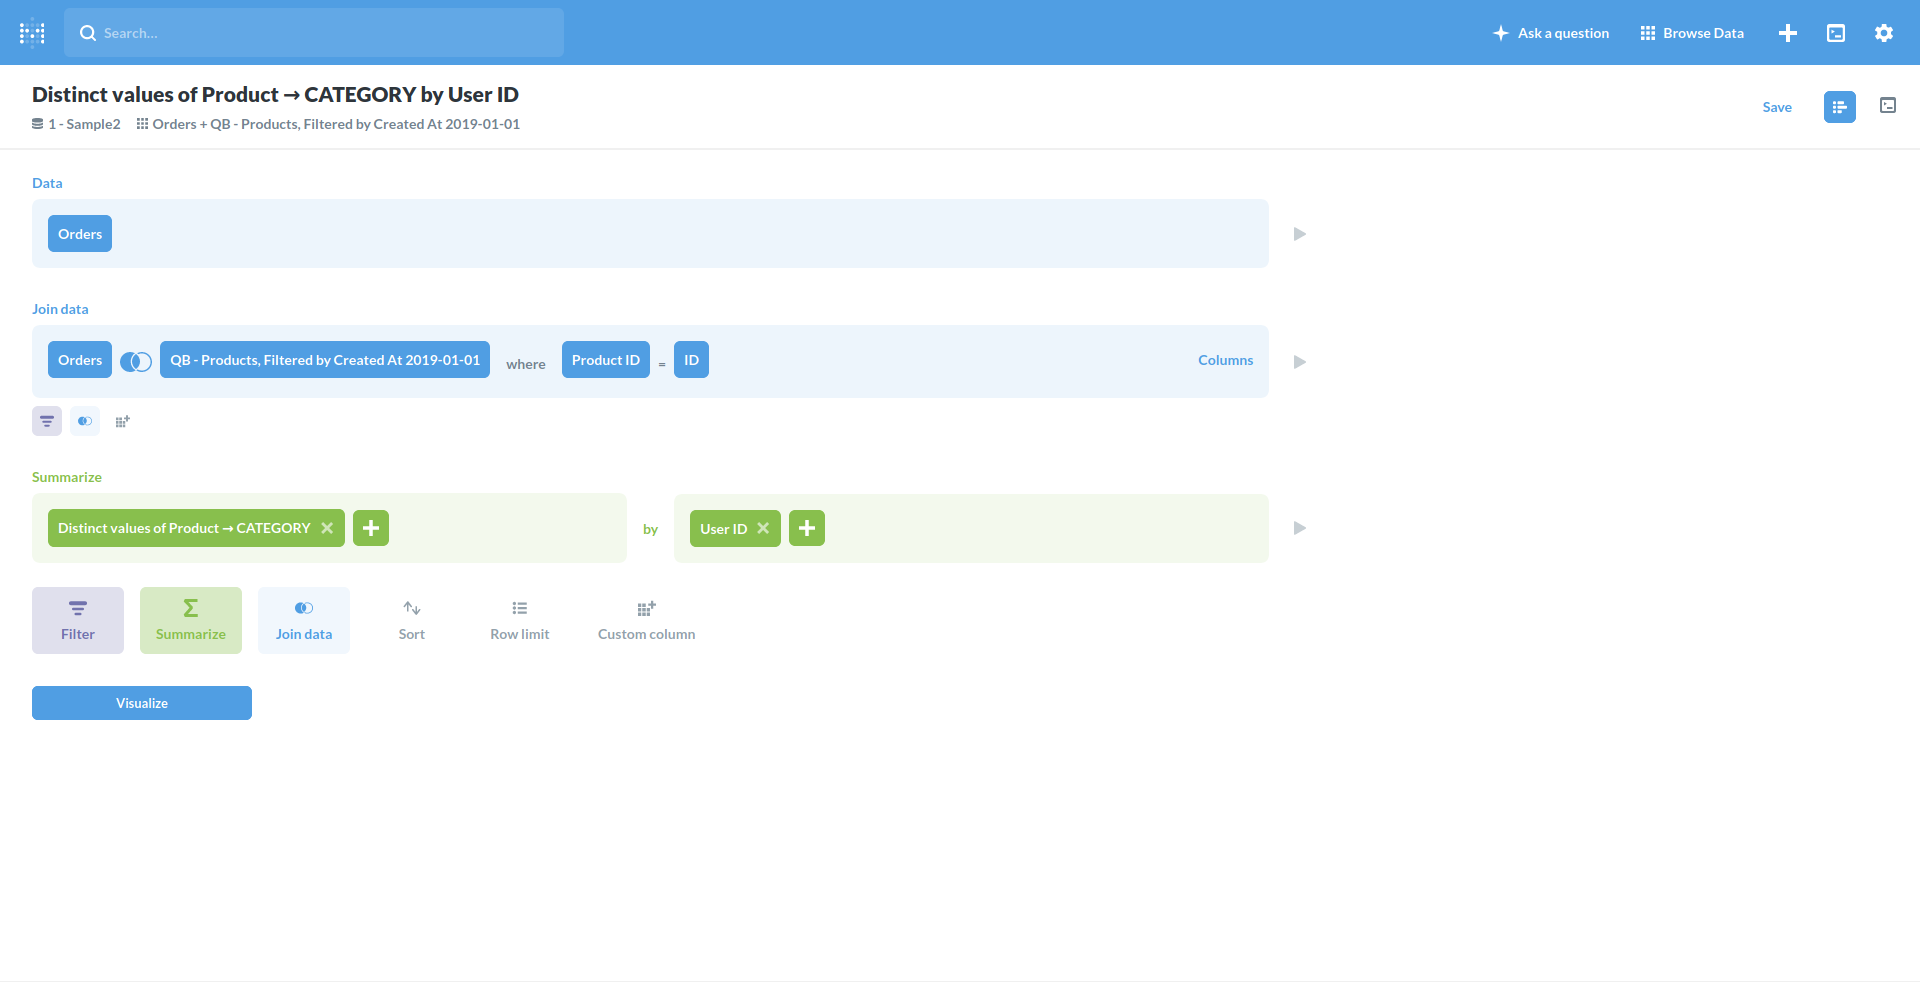
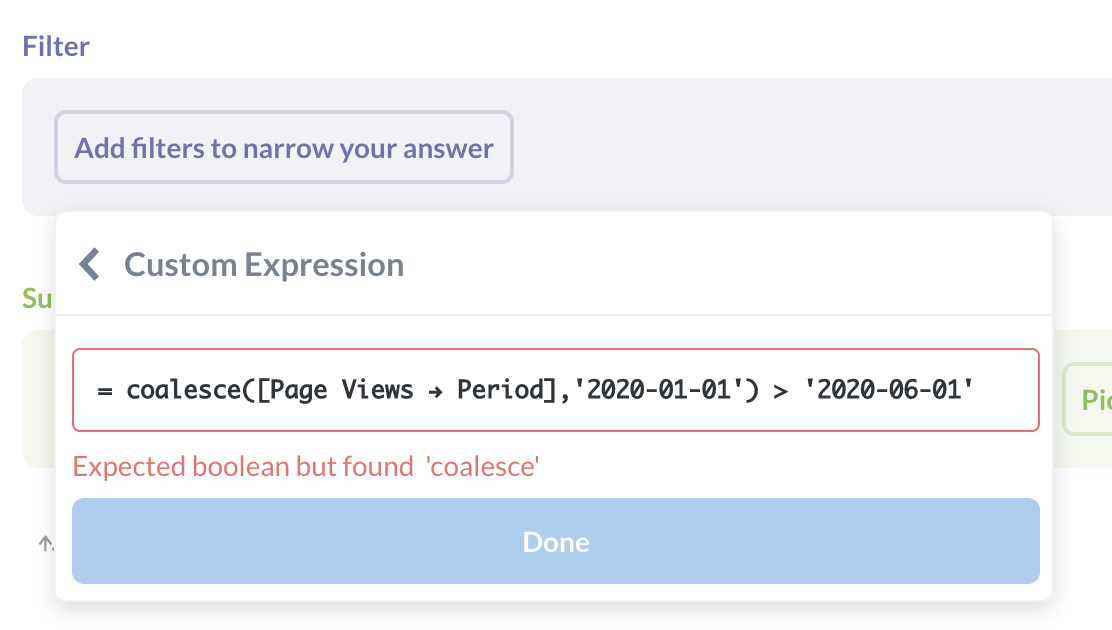
When I try to help users do this via the query builder, I don't have the option of putting the date logic in the join criteria and have to do it in the filter section. That turns it into an inner join. I also tried a custom expression adding a coalesce statement around date field in the activity table but that doesn't work either.
I know that I can just tell people to do the inner join, but it makes any chart feel incomplete to me. Any ideas or suggestions for how to accomplish this?
Dan