fimp
1
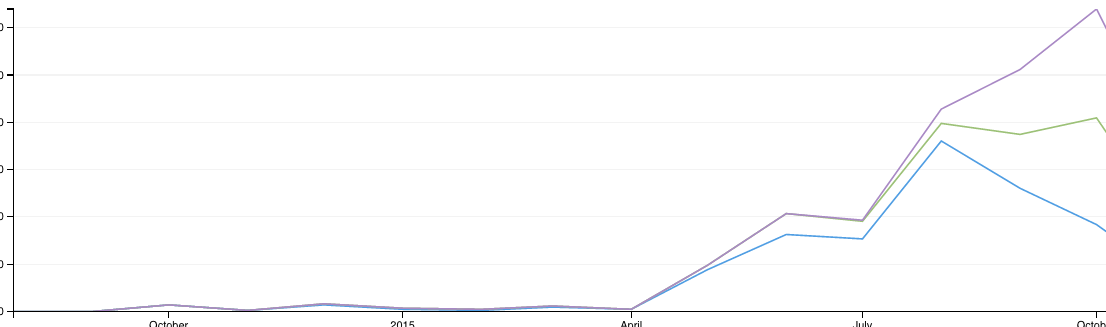
It's great that Metabase can plot multiple series in one chart, like this:
However, there seems to be no way to see which curve represents which series.
I would like to feature request labels shown in charts with multiple series. The labels could be derived from the column headers.
sameer
2
we’re working on that in https://github.com/metabase/metabase/pull/1859 which is slated for 0.15, our next version.
If you have specific edge cases you’re interested, please chime in on https://github.com/metabase/metabase/issues/656 where the conversation around that feature was done.
1 Like
fimp
3
Cool! Looking forward to it.
fimp
4
Is there a feature request already for being able to have multiple series non-stacked? Currently only stacked seems possible.
sameer
5
That Pull Request makes a lot of changes to how things work with multiple data series on charts. It’s scheduled for release next monday
sameer
6
0.15 went live yesterday, so if you update, you should be able to see how the feature works now
fimp
7
Hi. Trying to figure out how to use the new multiple series feature. The link to the “Visualizing multiple series” here is broken: http://www.metabase.com/docs/v0.15.1/users-guide/start.html
fimp
8
sorry about that. just fixed that broken link. same content as the v0.15.0 docs though.